Underperforming Franchise Stores: 12 Warning Signs Before Sales Drop
Catching underperforming franchise stores early with 12 signals that appear before sales drop
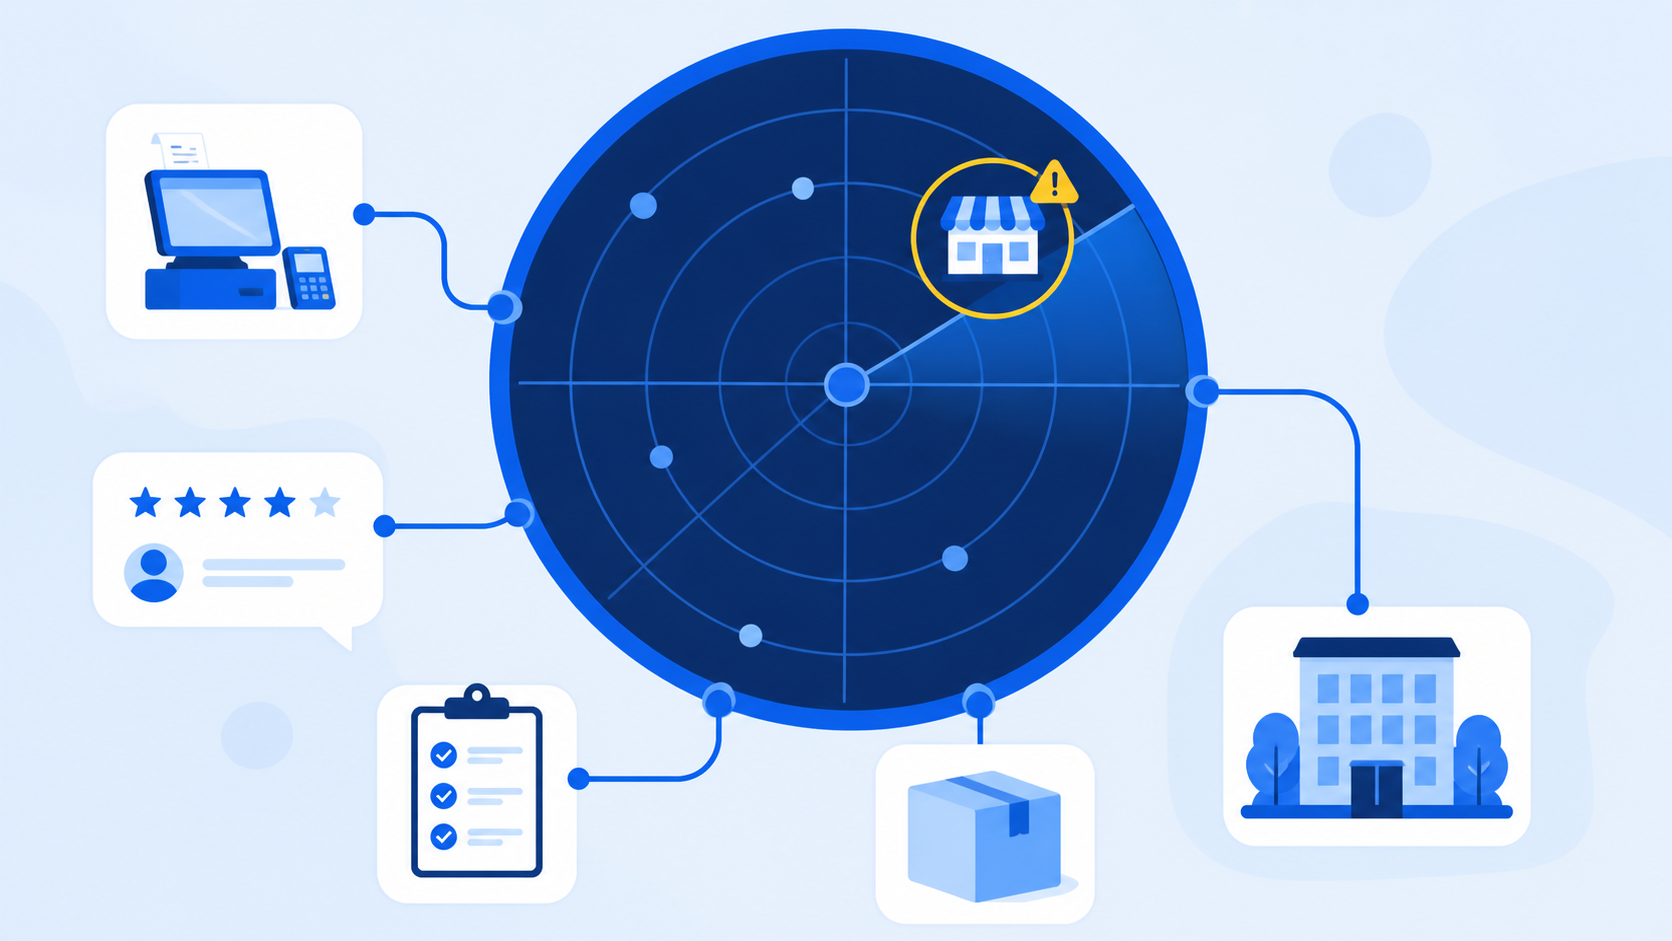
A structure for managing the leading signals that appear before sales decline in one place
CORE SUMMARY
✓ Underperforming store management is a system that captures, through data, 12 leading signals that appear before sales decline.
✓ Sales are a lagging indicator, so you need to look at ordering, inspection, review, and CS data together to respond sooner.
✓ Each signal leads to real action only when it is linked to a data source, an alert recipient, and a recommended action.
✓ When QSCV inspections, POS sales aggregation, and store information are scattered, it is hard to check multiple signals at once.
Underperforming franchise store management is a headquarters system for detecting and responding to changes in operating indicators that appear before sales decline. Most franchisor headquarters recognize a problem only after the numbers turn down on the monthly sales report. By then, however, store owner fatigue and customer churn are often well advanced, and the cost of turning things around is far higher than with early intervention.
A common mistake
Many mistake the moment the numbers turn down on the sales report for the moment the problem began. In reality, signals were most likely already appearing earlier in ordering, inspection, and review data.
This article outlines 12 operational signals that precede sales declines, how to link each signal to real action, and the criteria headquarters should use when adopting such a system. Rather than stopping at “it finds problem stores automatically,” it details which indicators to connect and in what order.
Why you should watch leading indicators, not sales
The key to managing underperforming stores is not the sales decline itself but checking the leading signals that waver before it. Sales are an outcome that surfaces only after multiple causes pile up. Indicators such as changes in order volume, falling inspection scores, worsening review sentiment, and delayed CS handling often respond statistically earlier than sales, so managing them together lets you catch problems at an earlier stage.
Leading indicator management matters especially because of the very structure of the franchise business. Franchise stores are physically separated from headquarters, and HQ staff manage many stores at once. It is structurally difficult for headquarters to sense subtle changes at a single store in real time. That is why signals must first be defined based on data coming in from multiple channels, not on human intuition.
Also, you should not conclude a store is underperforming from a single signal. A temporary dip in sales in a given week may be due to seasonal factors or changes in the surrounding trade area. But if inspection scores are falling and negative reviews are rising at the same time as sales decline, that is grounds to treat it as a structural problem rather than a simple fluctuation. Managing underperforming stores is ultimately about raising the accuracy of your judgment by cross-checking multiple signals.
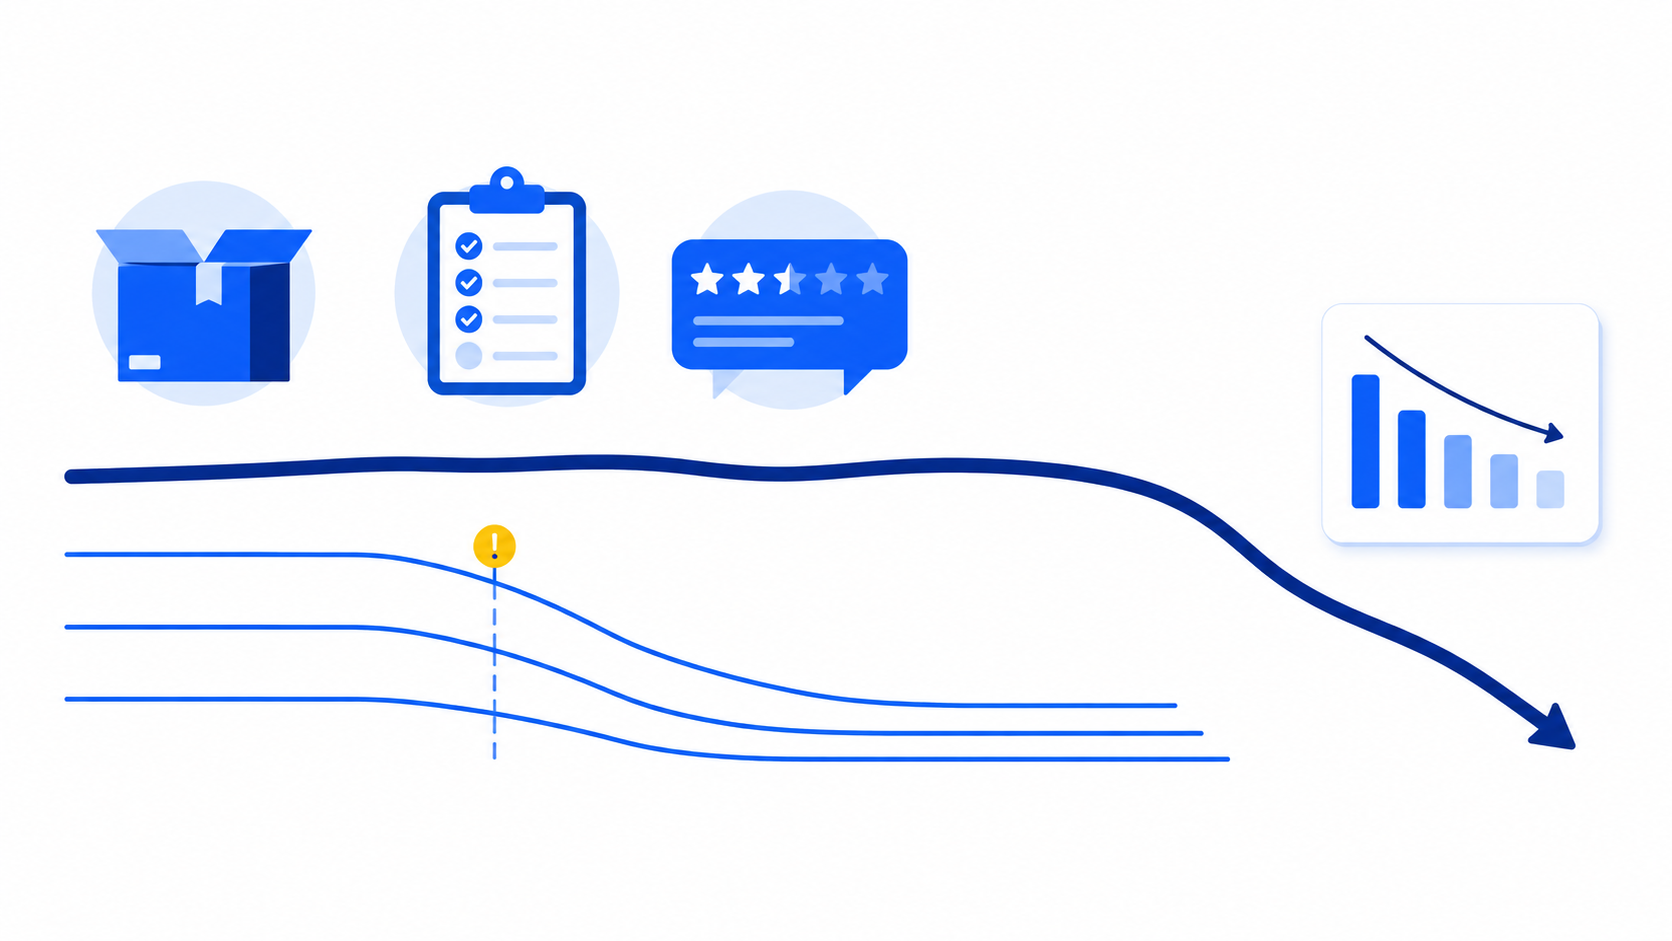
Sales are a lagging indicator; ordering, inspections, and reviews are leading indicators
12 anomalies that foreshadow an underperforming franchise store
To identify underperforming stores early, look at the 12 signals below together, by category. A single signal is weak grounds for judgment, but the more signals overlap at a store, the more likely it is to actually underperform.
| Category | Anomalies |
|---|---|
| Sales and average ticket | Sales decline rate on the same weekday over the last 4 weeks, rate of decline vs. the trade-area average, simultaneous drop in average ticket and order count, rise in discounts, cancellations, and comps |
| Ordering and inventory | Sharp drop in orders of key items, abnormal order-to-sales ratio, more frequent shortfalls below safety stock |
| Inspections and quality | Consecutive QSCV score declines, repeated unresolved issues on the same inspection item |
| Customers and CS | Rising share of negative reviews, longer CS handling times |
| Communication and operations | More unread notices and incomplete training |
These 12 items are not arbitrary; they are indicators representing five axes: sales, supply, quality, customers, and organization. Each axis reflects different causes, so looking at signals from only one axis can lead to misjudgment. If key item orders fell for three consecutive weeks and sales fell along with them, don’t simply conclude it is an off-catalog purchasing issue; check business hour changes, sellout history, review sentiment, and QSCV inspection results together to narrow down the cause.
Items that seem unrelated to sales at first glance, such as unread notices or incomplete training, actually function as leading signals. A store owner who consistently doesn’t check HQ notices may be becoming less engaged in overall store operations, and this often shows up earlier than other signals.

An anomaly framework built on five axes: sales, ordering, inspections, customers, and communication
How to link signals to data sources, alert recipients, and recommended actions
More important than listing signals is building a structure that links each signal to its data source, alert recipient, and recommended action. If no one has decided who checks a detected signal and what action to take, everything ends up depending on staff discretion and memory, and response is delayed again.
In practice, it works well to define the following three things for each signal in advance.
1
Data source: which data the signal came from (POS, QSCV inspections, reviews, CS history, etc.).
2
Alert recipient: who should be notified of this signal first (the assigned supervisor, regional manager, or HQ manager).
3
Recommended action: the minimum action to take when the signal occurs (field visit, phone check-in, retraining notice, etc.).
If QSCV scores fall two inspections in a row, an alert should go automatically to the assigned supervisor, and if the same inspection item remains unresolved repeatedly, the issue should escalate step by step to senior managers. The same goes for a rising share of negative reviews. Review data alone makes the cause hard to see, but checking it alongside CS history from the same period gives you grounds to tell whether the problem is slow service or declining quality.
Headquarters without this kind of linked structure rarely turn detected anomalies into real action. The more steps between signal and action that require staff to make manual judgments, the more delays and omissions increase.

The standard flow from signal to action
How to consolidate scattered operating data into a single system
To identify underperforming stores early, QSCV inspection results, POS sales aggregation, and store information must first be gathered on a single standard. When this data is scattered across different files and staff, checking the 12 signals above at the same time becomes difficult, and judging whether multiple signals overlap takes time.
FDAM manages QSCV inspections, POS sales aggregation, and store information on a single standard, providing a structure where you can follow falling inspection scores and sales changes on the same screen. Add the optional CS management and survey management features, and you can also review review-response and inquiry history within the same flow, so anomalies can be tracked on the same criteria even when staff change.
In development
Ordering and inventory data integration is currently in development. Following QSCV inspections, POS sales aggregation, and store information management, we are progressively expanding features so that ordering and inventory status can also be reviewed on the same screen.
Ordering and inventory signals become meaningful when viewed together with sales, inspection, and CS data, so the more they are handled on an integrated screen, the more accurate your judgment becomes. This kind of integration pays off even more when HQ headcount doesn’t grow in proportion to the number of stores. As the number of stores per staff member rises, manually cross-checking signals hits its limit, and you need a system that organizes signals automatically from a standardized data structure.
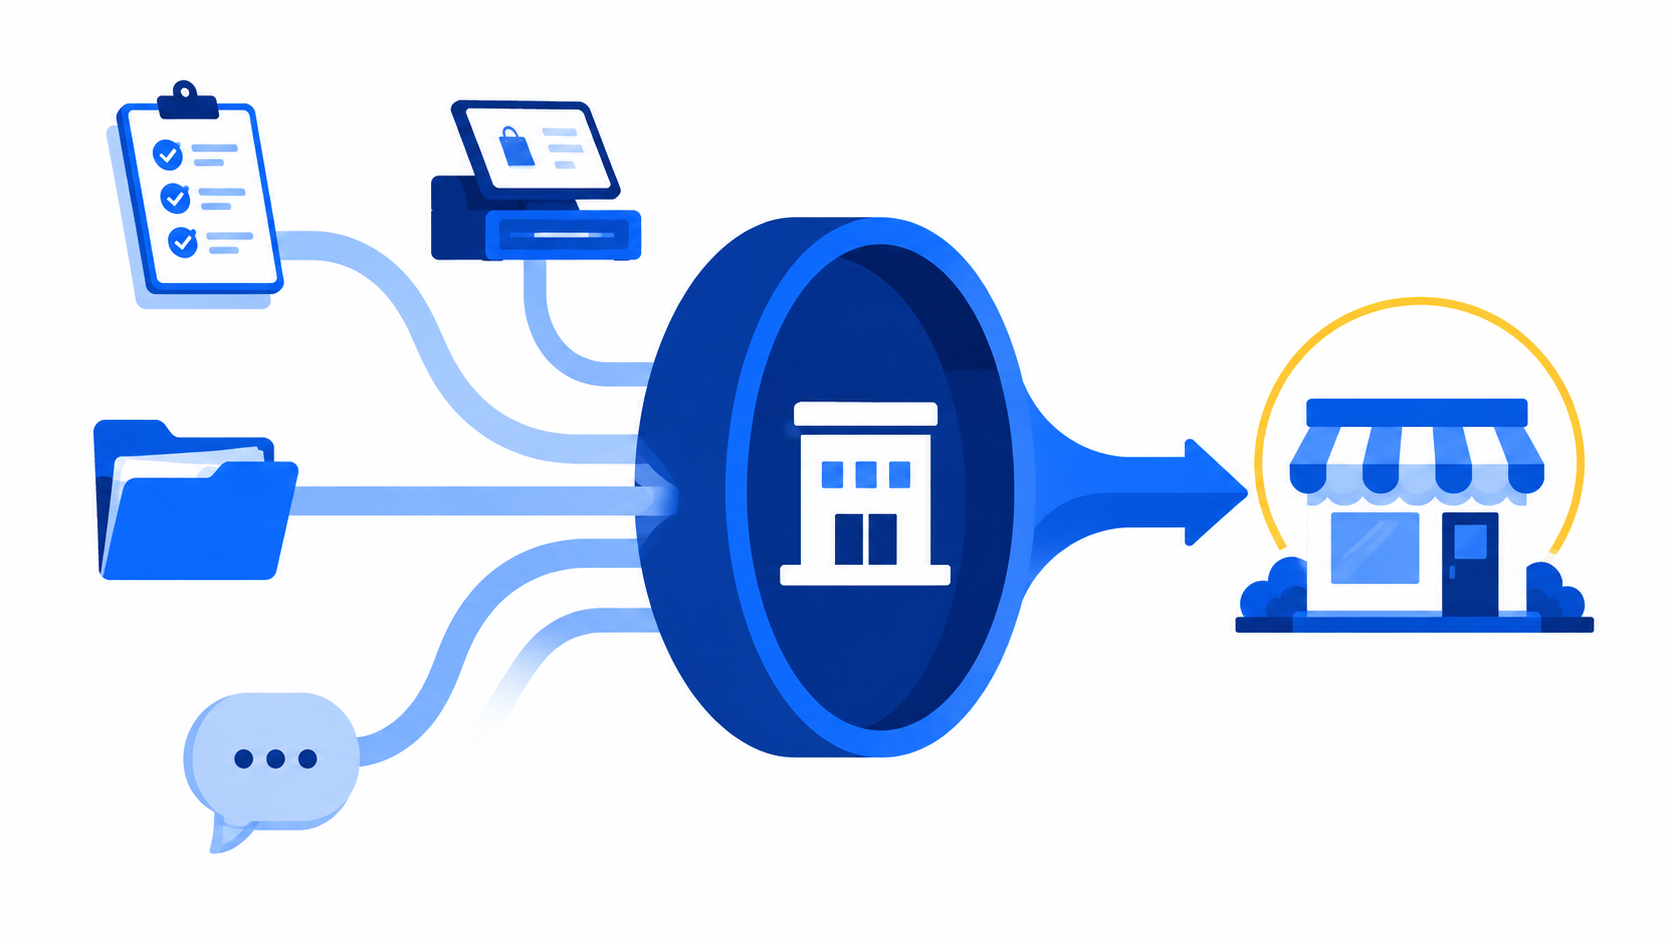
An operations management screen that integrates QSCV, sales, and store information on a single standard
What criteria should headquarters use to adopt an underperforming store management system?
When adopting an underperforming store management system, check three criteria before flashy features.
1
Scope of data integration: check whether sales, inspection, review, and CS data are actually connected in one place, or whether each exists only on its own screen.
2
Alert and escalation structure: the key is whether signals are automatically delivered to the responsible staff and escalated step by step to senior managers if left unresolved.
3
Field usability: success hinges on whether supervisors and store owners can enter and review data without burden in their actual workflows.
Unlike general ERPs, software for franchisor headquarters must be designed around franchise-specific operating models such as franchise structures, royalties, and supervisor organizations. As a software company specializing in franchises, MS Benter draws on its experience building HQ operations for more than 500 brands to design FDAM’s operations management module around these three criteria.
With a system that meets these three criteria, headquarters can shift from reacting after sales turn down to acting first while signals are still building.

Scope of data integration, alert structure, and field usability
FAQ
Q1. Can you start managing underperforming stores after sales have dropped?
A. Sales declines are a lagging indicator, so by that point causes such as falling inspection scores or worsening reviews are often well advanced. Setting up a system that also tracks leading indicators is the way to respond sooner.
Q2. Which of the 12 signals should you check first?
A. Rather than drawing conclusions from a single signal, judgment is more accurate when you first check stores where two or more of sales, ordering, inspection, review, and CS data are wavering at the same time.
Q3. Can FDAM also manage ordering and inventory data?
A. FDAM is progressively expanding its features so that, following QSCV inspections, POS sales aggregation, and store information, ordering and inventory status can be reviewed together as well.
Q4. Do headquarters with only a few stores need an underperforming store management system?
A. Regardless of store count, if staff manage multiple stores at once, manually cross-checking signals every time has its limits, so a data-driven system helps.
Check the signals before sales turn down
If sales, ordering, inspection, review, and CS data are scattered in different places and it is hard to see the signals at a glance, we recommend taking a look at FDAM’s integrated operations management structure.
Contact salesLearn more about FDAM
Underperforming store management, Franchise store sales analysis, Franchise closure prediction, Causes of store sales decline, Franchise problem store management, QSCV inspection, Store operations data integration, Franchisor headquarters, FDAM, Franchise store operations management, Franchise ERP, POS sales aggregation