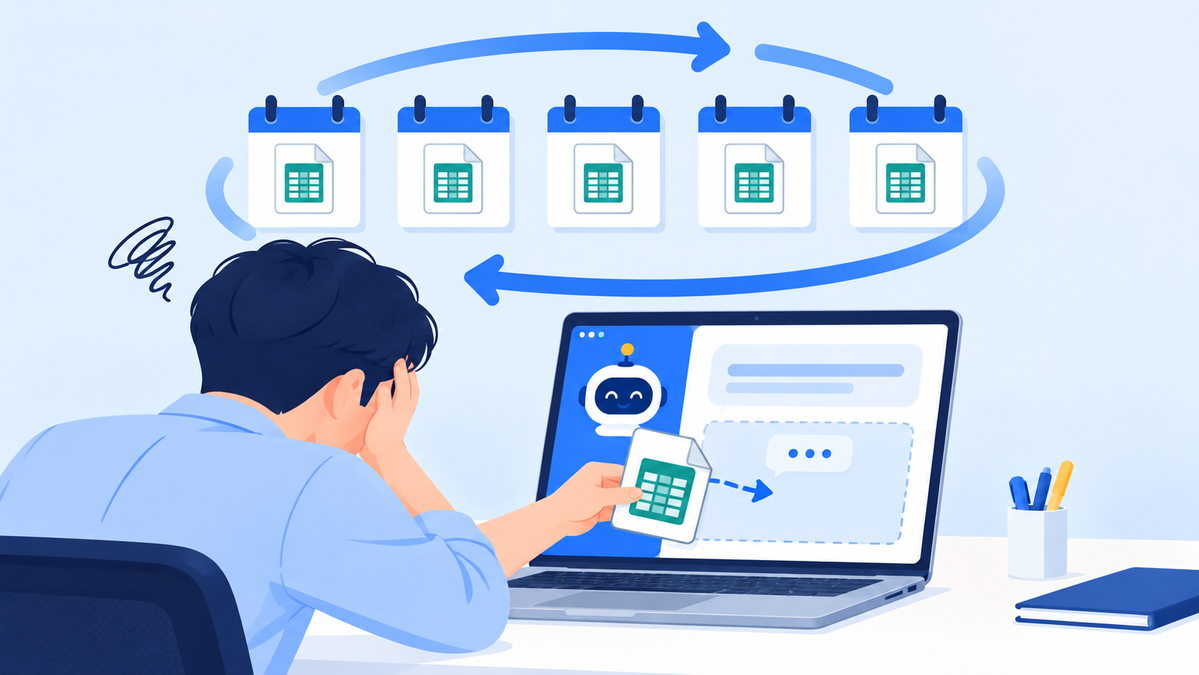
Why Franchise AI Is Moving from Reports to Store-Level Action Items
How franchise AI generates action items, and the steps to prepare for it

Bringing store data together on one screen is the starting point for AI analysis.
CORE SUMMARY
✓ In the global franchise industry, some companies are moving from AI that displays analysis results to AI that assigns action steps to specific staff members.
✓ For AI to recommend meaningful actions, at least six types of data, including POS, labor cost, inventory, scheduling, CS and financials, need to be standardized together.
✓ Store staff, regional supervisors and HQ executives each need information at a different depth so that alerts don't turn into extra workload.
✓ FDAM standardizes QSCV inspections and POS sales tallies on an HQ basis, building the data foundation needed before adopting AI.
Franchise AI refers to operations support technology that analyzes operating data generated in stores, such as sales, staffing and inventory, and tells HQ staff which items need action. Recent global cases show a shift underway in some places, from "displaying analysis results" to "assigning who needs to do what, and when." That's because, as the number of stores grows, it becomes increasingly difficult for HQ staff to filter every anomaly signal by hand.
This post covers, in order, the changes seen in global cases, the data conditions AI needs to generate actionable steps, the difference between report-style and action-oriented AI, and the order in which Korean franchisor headquarters should organize their data to prepare for this shift.
Why franchise AI is getting attention now
Franchisor headquarters are bringing AI into operations not because they want to try new technology, but because HQ headcount doesn't grow in proportion to the number of stores. With 10 stores, staff can review sales sheets and inspection results themselves without much trouble, but at 50 or 100 stores, having people check all the data every day runs into physical limits.
At this point, AI's role is not to display data more attractively but to flag anomaly signals that people tend to miss. For this to work, however, there is a precondition: store data must be accumulated on the same basis. If each staff member fills out inspection checklists in a different format, or sales data is tallied differently at each store, AI can't make comparisons at all. As the global cases below repeatedly show, the first step in adopting AI is not choosing an AI model but standardizing HQ's internal data.
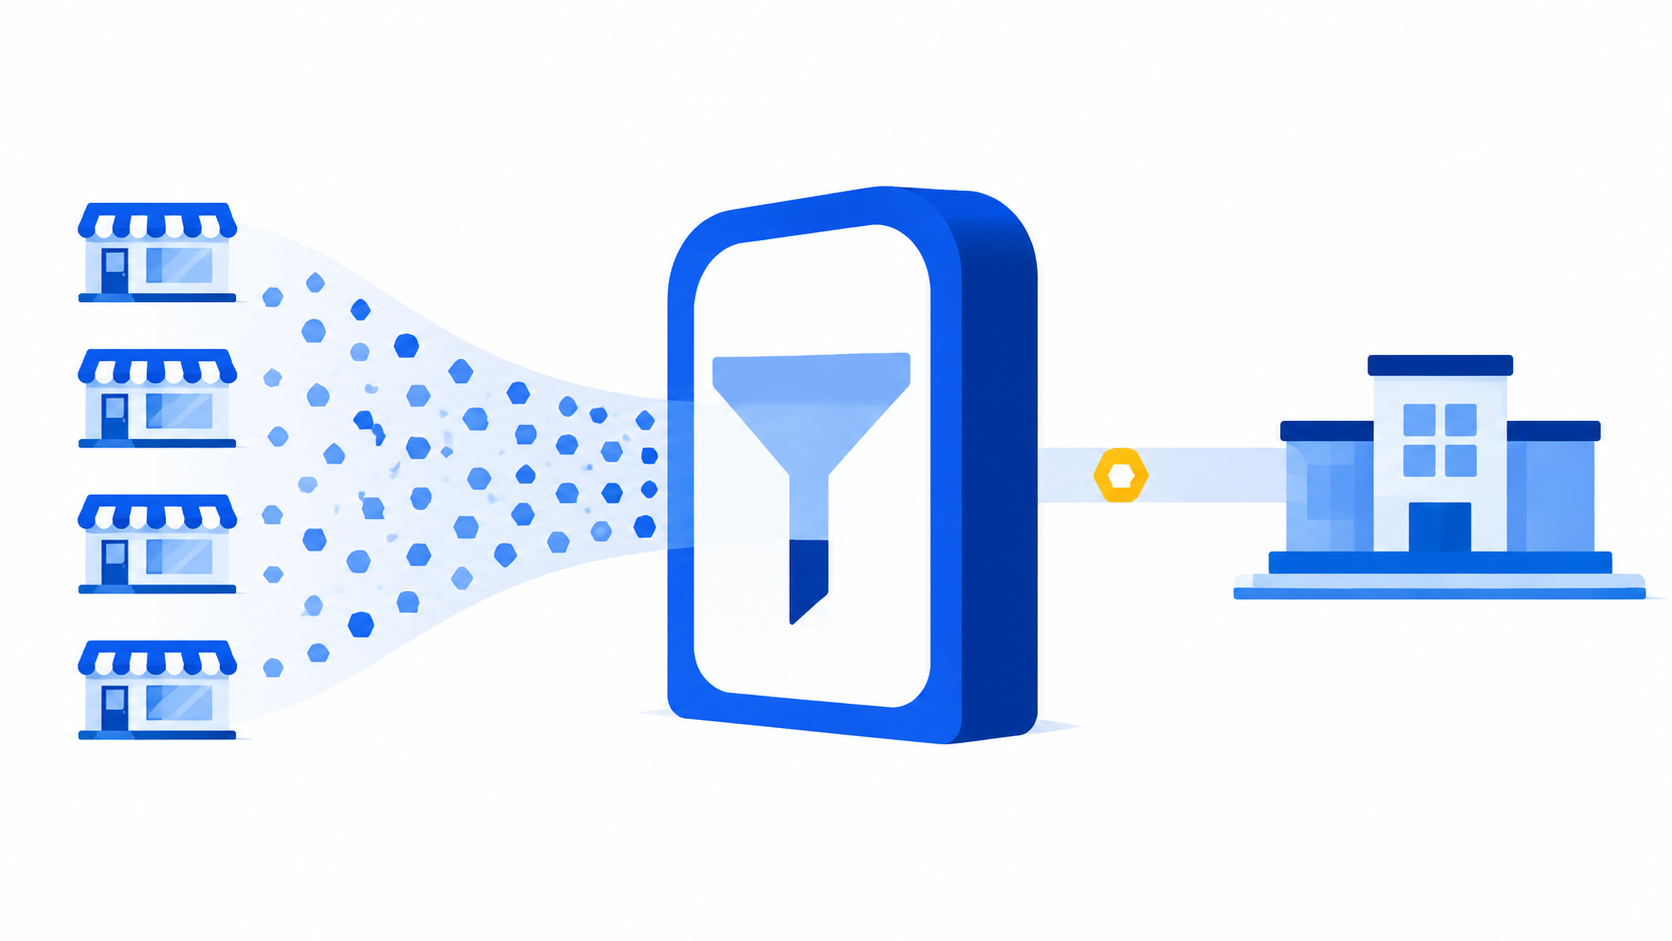
As stores multiply, so do the anomaly signals HQ has to filter on its own.
Recent changes in the global franchise market
One Taco Bell operator in the US has connected POS, labor cost, inventory, work schedule, customer feedback and financial data from 23 stores to AI, automatically detecting sales anomalies, staffing inefficiencies and inventory discrepancies and receiving recommended actions for each staff member (QSR Web, 2026.09.02).
POINT 01
A survey released around the same time found that digital channels accounted for about 23% of sales, up about 22% year over year, and that the average digital order was 28% larger than in-store orders (Food On Demand, 2026.09.01).
Looking at the two trends together makes the implication clear: as sales channels diversify, the types and volume of data HQ needs to watch grow too. If digital orders, in-store orders, inventory and labor costs are scattered across different systems, every new channel adds to HQ's blind spots. Conversely, if this data is accumulated in one place in a comparable form, more channels actually become material for sharper decisions. For Korean franchisor headquarters, too, channels are already fragmenting across delivery apps, stores and in-house apps, so this case is hard to dismiss as someone else's story.

Combining data from multiple stores makes store-to-store comparison possible.
Six types of data AI needs to generate actionable steps
For franchise AI to recommend meaningful actions, at least six types of data need to come in together: POS sales, labor costs, inventory, work schedules, customer feedback (CS and reviews) and financial data.
It's easier to see why all six are needed by thinking about it in reverse. With POS sales alone, you can tell "how much sales fell" but not "why." Add inventory data, and you can tell whether the loss was due to stockouts; add customer feedback data, and you have grounds to judge whether it's a quality or service issue. In other words, each additional type of data narrows the range of causes AI can pinpoint.
The problem with scattered data
The problem is that these six types of data are usually managed by different people, with different tools, on different cycles. It's common for sales to sit in the POS system, inspection results in Excel or paper documents, and customer inquiries in KakaoTalk or personal inboxes. In this state, no matter how good the AI model you attach, you'll only get "something's off" signals, and it's hard to get actionable results that pinpoint the cause and the store responsible.
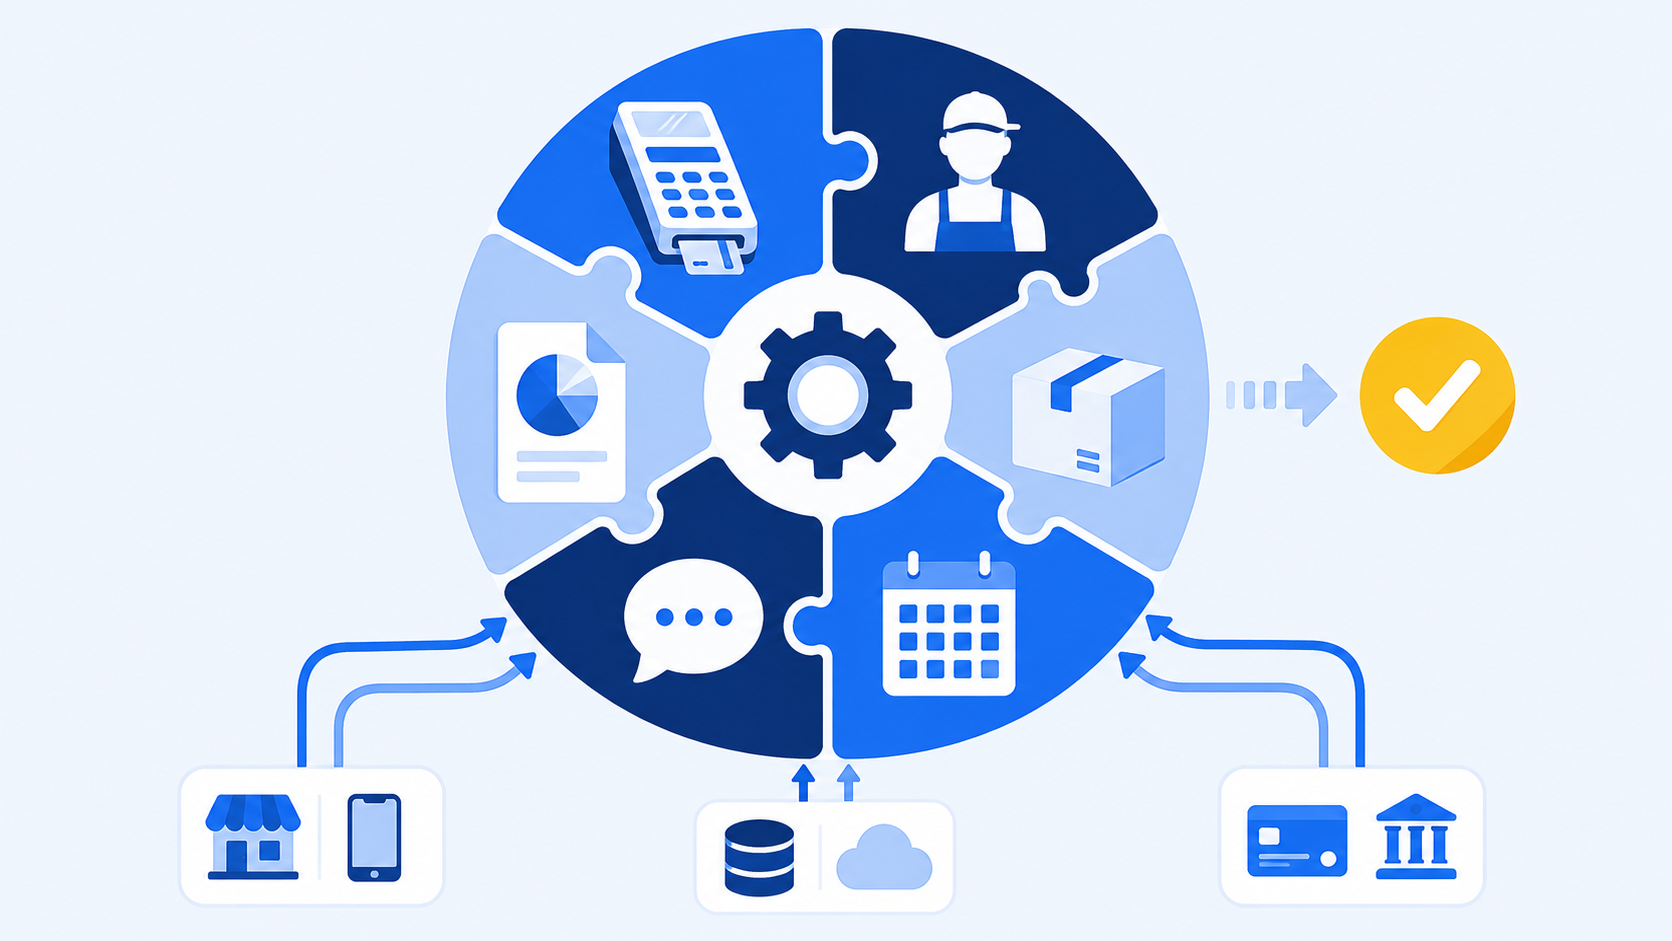
If even one of the six types of data is missing, AI can't pinpoint the cause.
How report-style AI differs from action-oriented AI
Report-style AI stops at summarizing past data, while action-oriented AI connects anomaly signals to next steps, along with the person responsible, the store and a deadline. For example, if a store's sales suddenly drop, report-style AI only shows a chart, whereas with action-oriented AI, when staff ask the AI assistant for the cause, it lays out what to check next, in order, based on QSCV inspection history and recent customer review data.
This difference isn't just a feature gap; it's what reduces the workload on HQ operations staff. In a report-style setup, staff have to look at charts and infer the cause themselves every time, but in an action-oriented setup, existing inspection and review data is presented as supporting evidence, cutting the time spent on inference. Still, the precondition remains: the six types of data discussed above, especially inspection results and customer response data, must first be accumulated in a standardized form.
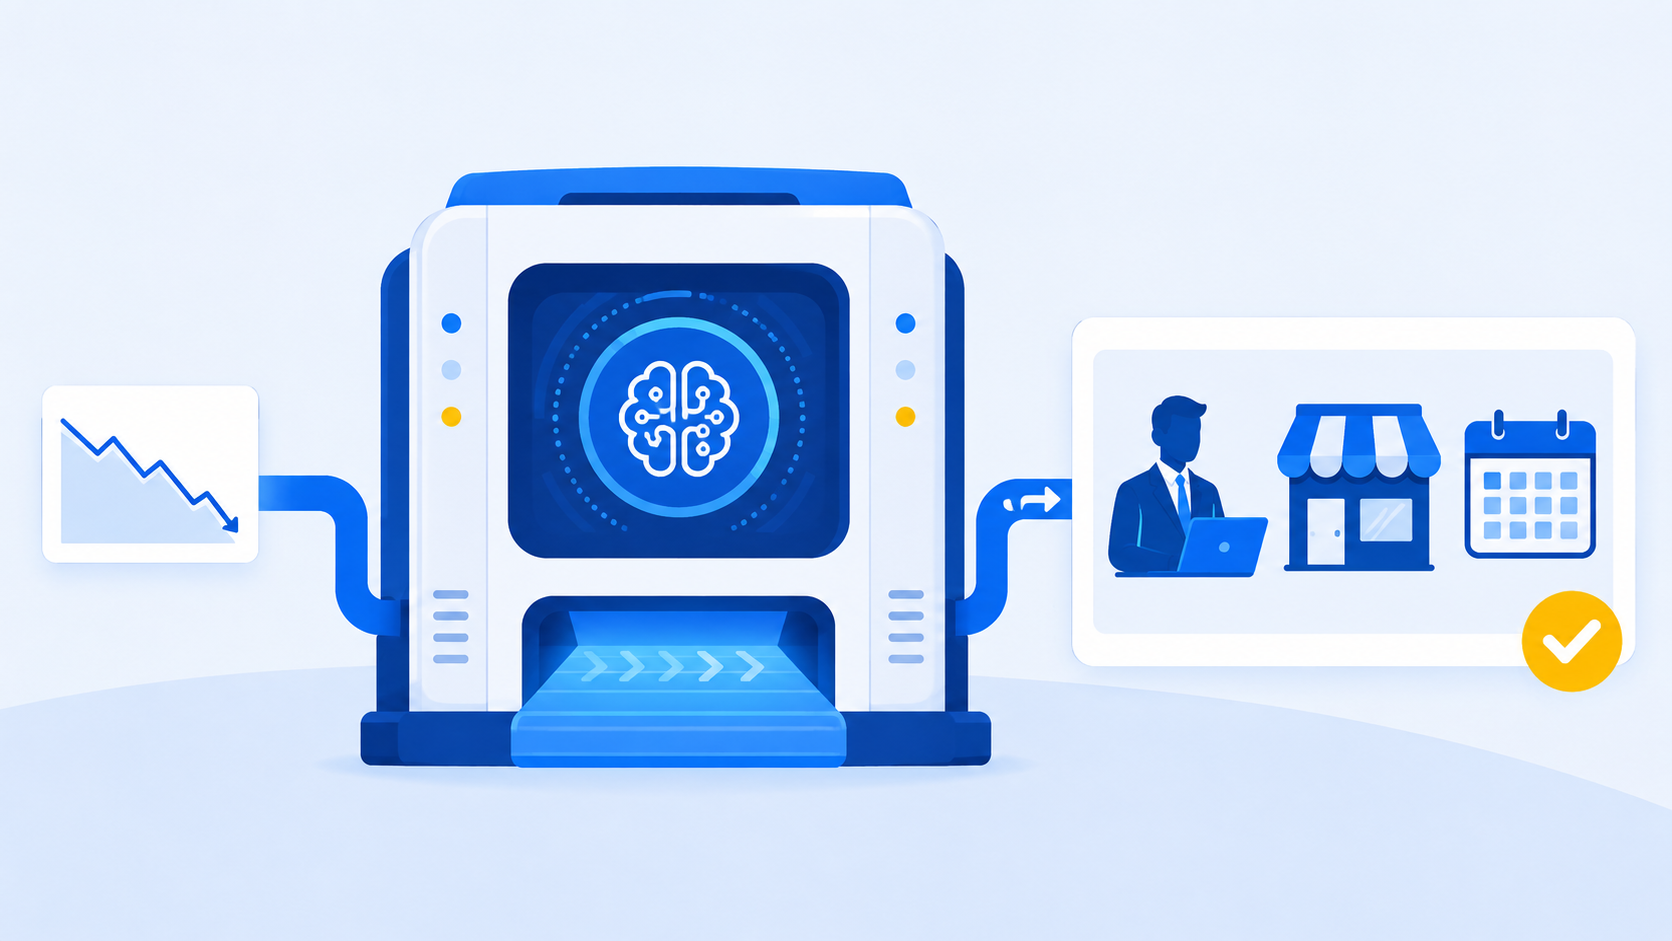
The same anomaly signal can lead to different next steps depending on how results are presented.
Designing information by store, region and role
Even for the same anomaly signal, store staff, regional supervisors and HQ executives need information at different depths. Store staff should get what to check today, regional staff a priority list comparing multiple stores, and executives the brand-wide trend.
What's often overlooked when designing this structure is the assumption that "giving everyone more of the same information is safer." In reality, it's the opposite. Sending region-wide statistics to store staff blurs what they need to do today, and sending store-level details to executives makes them miss the trends they should be watching. The key is not the amount of information but adjusting its depth to each role's scope of decision-making. Without this structure, alerts and reports can end up adding to the workload instead.
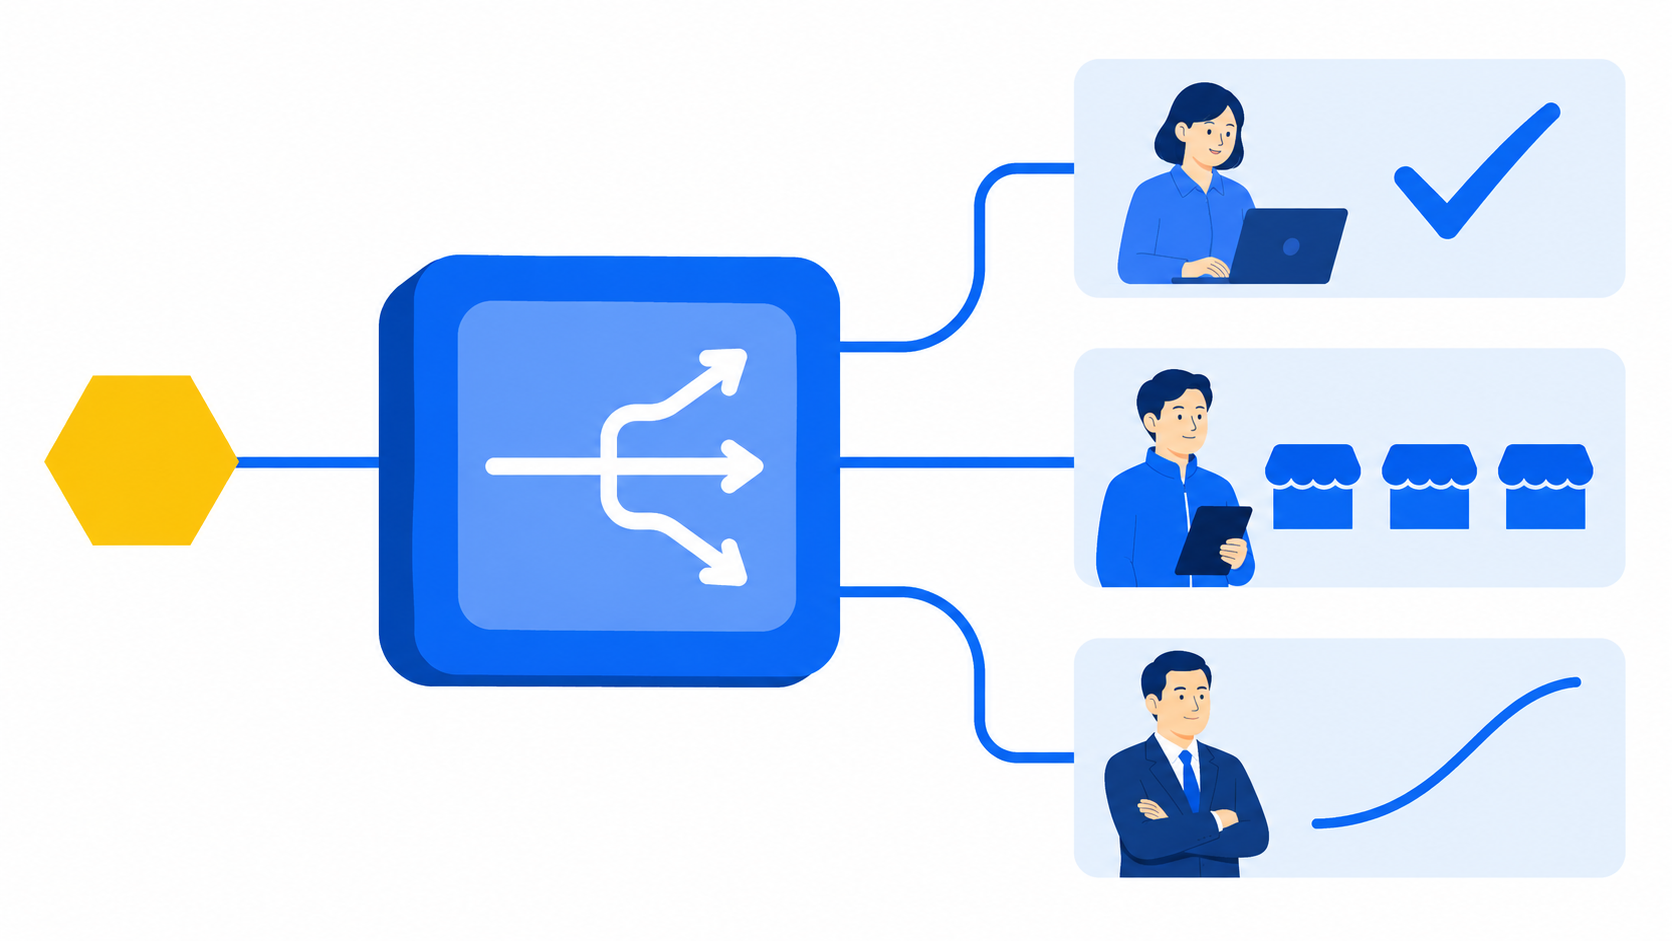
Even with the same data, the depth of information needed varies by role.
The order in which Korean franchisor HQs should prepare
Before adopting AI, the first thing HQ should do is standardize its data. The three steps below translate the global cases and data conditions discussed above into a practical sequence for Korean franchisor headquarters.
| Step 1 | Standardize QSCV inspection, POS sales and CS intake data on the same basis |
| Step 2 | Segment data by staff member, store and region, and design who receives what information |
| Step 3 | Prioritize recurring anomaly patterns and turn them into AI analysis items |
FDAM includes an operations management module that standardizes and accumulates store QSCV inspections, POS sales tallies and store information on an HQ basis, supporting the work in Step 1 above. When inspection results and sales data are organized on the same basis, it becomes much faster to pinpoint which metric at which store is an anomaly signal once you later adopt AI analysis.
Add the CS management option, and you can view customer inquiries and reviews within the same structure, bringing information that was scattered across staff members onto a single screen. As Korea's first franchise-specialized software developer with a long track record in franchise IT, MS Benter runs FDAM with this shift in mind.
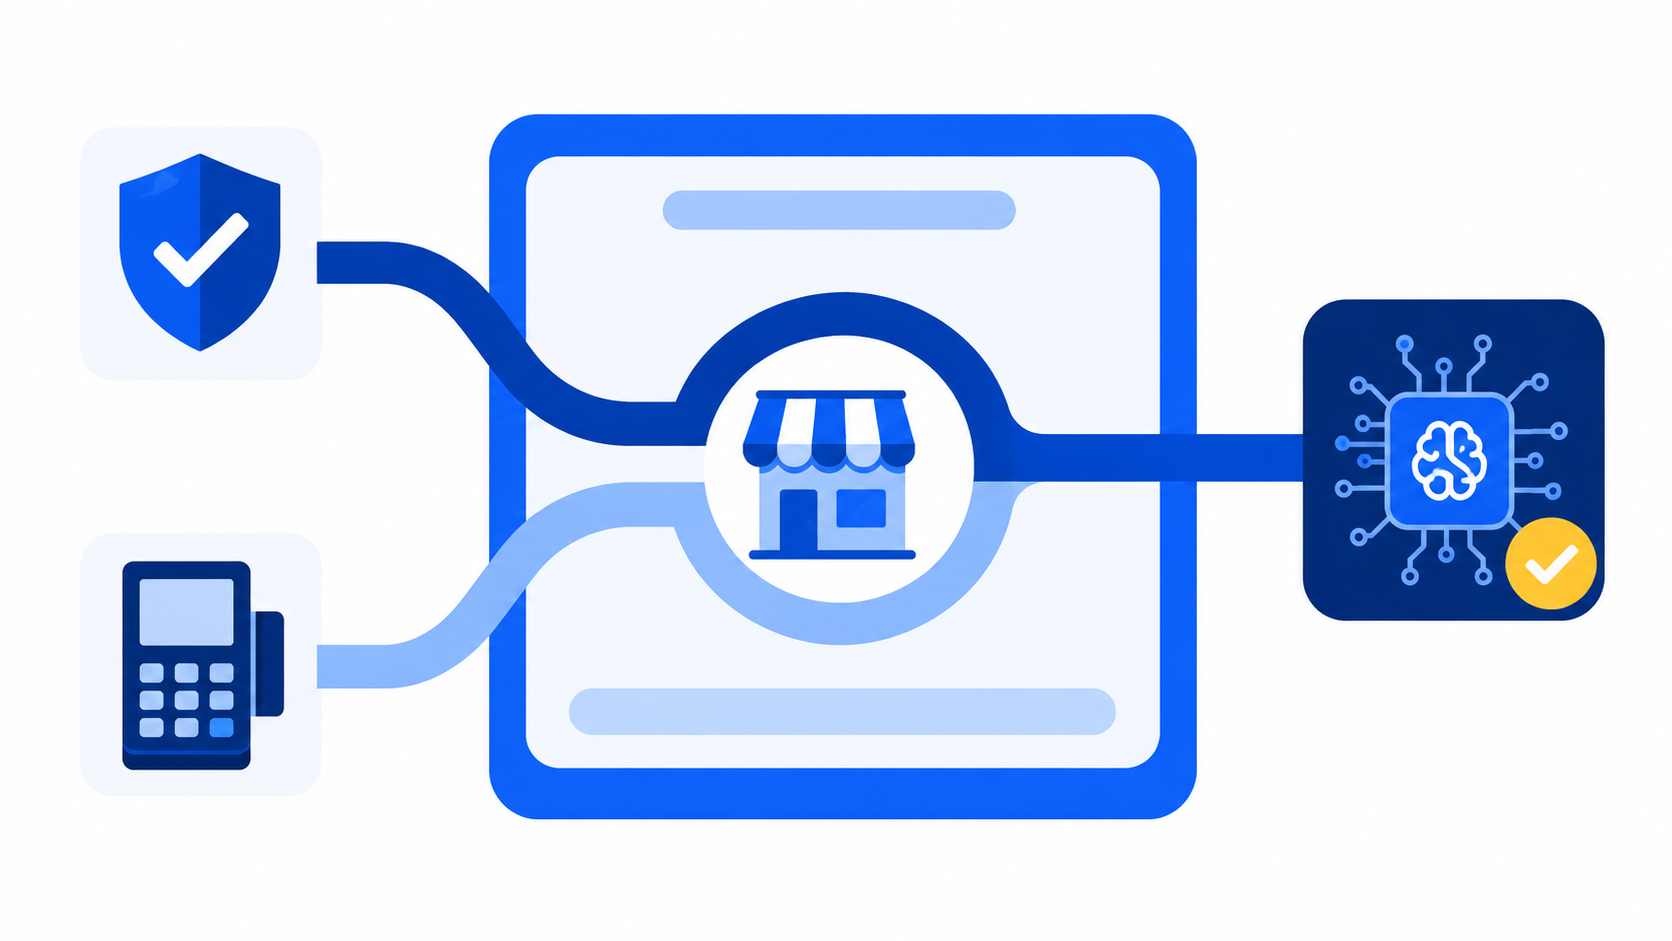
Once inspection and sales data are organized on the same basis, adopting AI analysis later becomes much easier.
Frequently asked questions
Q1. Do we need a large number of stores to adopt franchise AI?
Whether your data is standardized matters more than the number of stores. If inspection, sales and CS data are accumulated on the same basis, meaningful analysis is possible even with a small number of stores.
Q2. Can we go straight to AI analysis with FDAM?
FDAM is an operations management foundation that standardizes and accumulates QSCV inspections, POS sales tallies and store information. Once this data is organized, you can naturally expand into AI analysis.
Q3. If our data is scattered across multiple systems, is AI adoption impossible?
It isn't impossible, but its effectiveness drops significantly. AI can detect anomaly signals even in scattered data, but to produce actionable results that pinpoint the cause and the store responsible, the data first needs to be brought together on a single basis.
Q4. Is AI used for review responses too?
Yes. AI generates draft review replies to help maintain the brand's tone. The store owner handles the final response.
In the global franchise market, more and more companies are using AI not as a "tool for showing" but as a "tool for assigning action." To keep up with this shift, HQ first needs to start accumulating inspection, sales and CS data in a standardized structure.
Is your HQ's POS, QSCV and CS data structured for AI analysis?
Standardize your franchise operating data, starting with FDAM
Contact salesLearn more about FDAM Chat on KakaoTalk
franchise AI, franchise ERP, franchise store data analysis, franchise store profitability, FDAM, QSCV inspections, POS sales tallies, franchise operations management, store operating data, data standardization, franchisor headquarters, AI operations management