AI Prompts for Franchise Store Sales Analysis: What to Check First
A guide to the data standards headquarters should check, and the operations report prompts to use, before analyzing franchise store sales with AI.

Before analyzing franchise store sales with AI, check your data standards first.
CORE SUMMARY
When analyzing franchise store sales with AI, report quality is determined first by your data standards, not by the prompt.
If store codes, reporting periods, and sales definitions are not standardized, the same data can lead to different conclusions.
Reviewing sales and review data together lets you prioritize which stores to look at first.
If this process repeats every week, it is time for a shared HQ data management system rather than individual prompts.
AI analysis of franchise store sales means giving store-level sales data to AI to identify trends and anomalies, and compiling the results into an HQ operations report.
Hand AI a sales file, and it can produce a draft report in no time. But look at day-to-day work at franchisor headquarters, and the steps before writing the report often take far longer. You download each store’s sales file, align store names, check cancellation and refund data, and then hunt down reviews separately on other channels.
This article covers the data standards headquarters should check before handing sales data to AI, prompts you can use as-is in practice, and the structural problems that arise when this work repeats every week.
The quality of an AI report is decided by data standards before prompts
Even with the same sales file, different data standards produce completely different analysis results. A figure showing that a store’s sales fell 15% from the previous week can mean something entirely different depending on whether the comparison period included a public holiday, whether certain weekdays were missing, and whether cancellations and refunds were reflected.
AI calculates and organizes the data it receives quickly, but it cannot work out your headquarters’ sales aggregation rules or store-specific exceptions on its own. So before searching for a good prompt, first ask: “Is our franchise store data organized in a state AI can analyze?”
If that question is hard to answer right away, you need to go through each item, from how store names are written to sales definitions and how missing values are handled. Starting in the next section, we look at these standards in detail, along with prompts you can actually use.
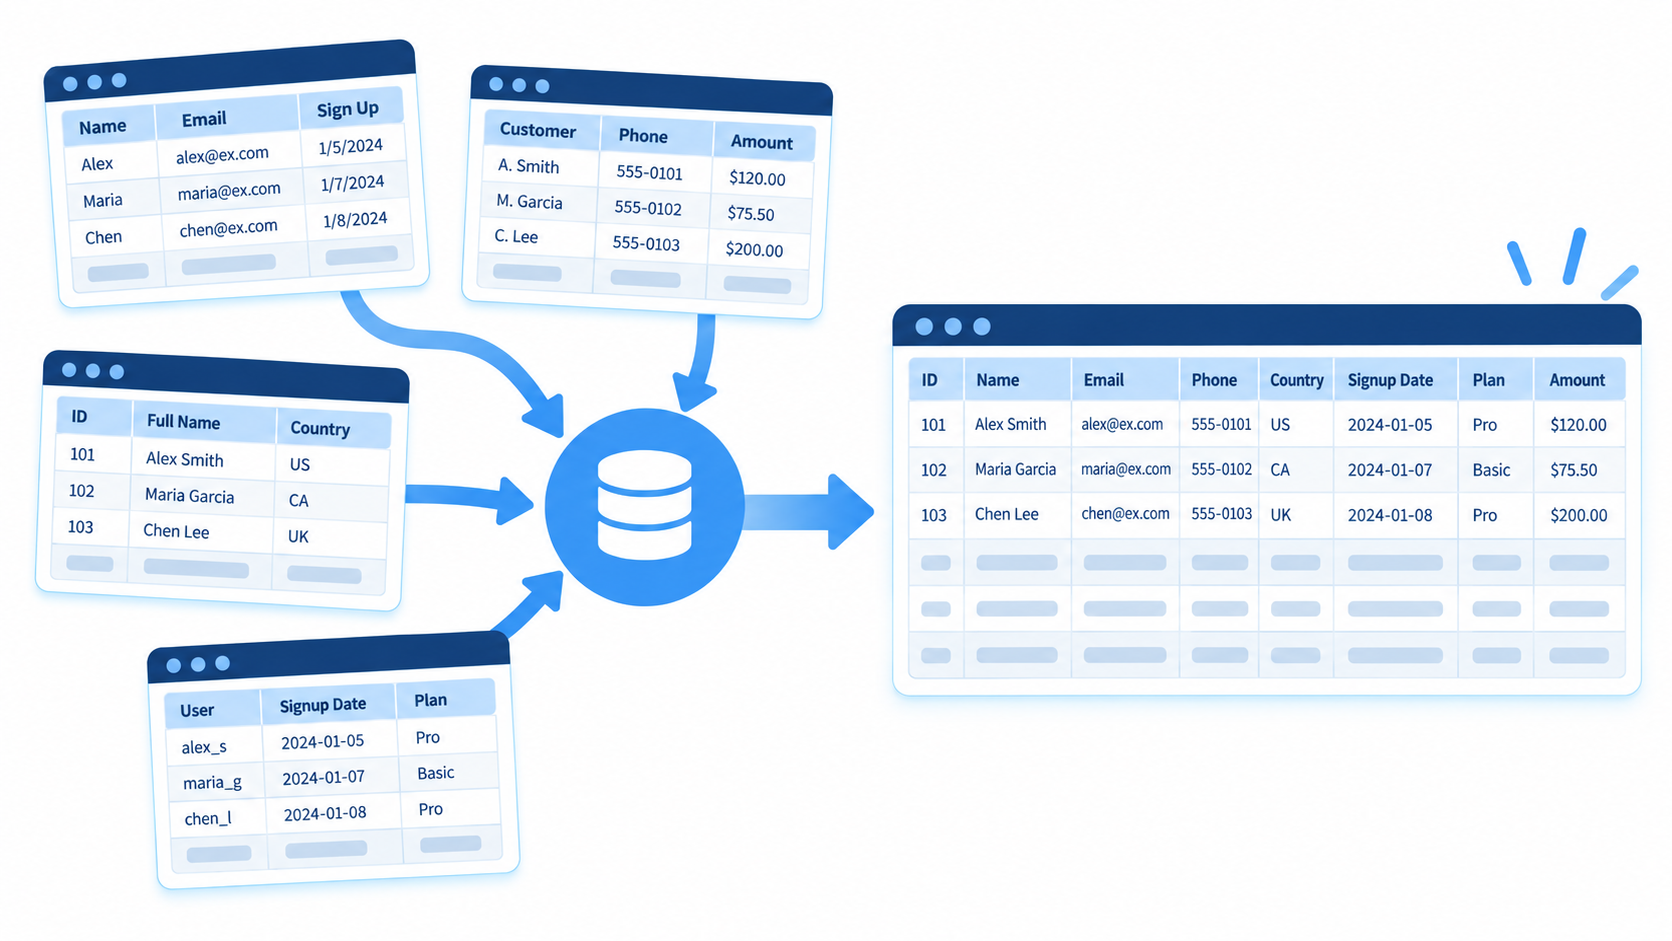
Different sales aggregation standards lead the same data to different conclusions.
Standardize store codes, reporting periods, and sales definitions first
To analyze franchise store sales data with AI, at least three standards must be unified.
First, a common code that identifies each store. When the same store appears differently from file to file, such as “Gangnam,” “Gangnam Station,” and “Seoul Gangnam,” a person can infer it is one store, but there is no guarantee AI will always treat them as the same. Data should be linked by a unique store code managed by headquarters rather than by store name, and if store names, business registration numbers, and POS codes differ, you also need a separate mapping table.
Second, comparison periods and operating days. When comparing sales week over week, matching dates is not enough. You need to check the number of operating days in both periods, the weekday mix, public holidays, and any temporary closures so that the rate of change actually reflects business conditions.
Third, the definition of sales. Gross order value versus actual payments, sales before or after discounts, whether cancellations and refunds are included, and whether VAT and delivery fees are included can all produce different numbers from the same file. If you only have sales data, limit the scope of analysis to changes in sales. Concluding that profitability improved without cost data such as cost of goods, labor, and rent is not well supported.
On top of that, it is important to distinguish missing values from zero. Data that was never collected and actual sales of zero are different situations, and if missing cells are arbitrarily treated as zero, a store operating normally may be misclassified as underperforming.
You can use the following prompt to put these standards into practice.
Copy-and-paste prompt
Organize the attached franchise store sales files into a single table ready for analysis.

1. First, check the column names and data units in each file.
2. Create a mapping table for the columns corresponding to store code, store name, operating days, total sales, actual payments, order count,
   cancellation amount, and refund amount.
3. If aggregation standards or amount definitions differ between files, don’t merge them right away;
   first tell me which differences need to be checked.
4. Don’t assume store names refer to the same store;
   link them only when the store codes match.
5. Don’t convert missing values to 0 or estimate values that don’t exist.
6. Separately flag duplicate rows, missing data, and possible store-matching errors.
7. Compare the total sales of the organized data with the totals in the original files.

Write the results in the following order.
- Data structure of each file
- Field mapping table
- Consolidated data for analysis
- Missing values, duplicates, and matching errors
- Total reconciliation against the original files
The key to this prompt is that it does not ask for sales analysis right away. First confirm how AI understood the data, and proceed with analysis only after field mapping and total reconciliation are done.
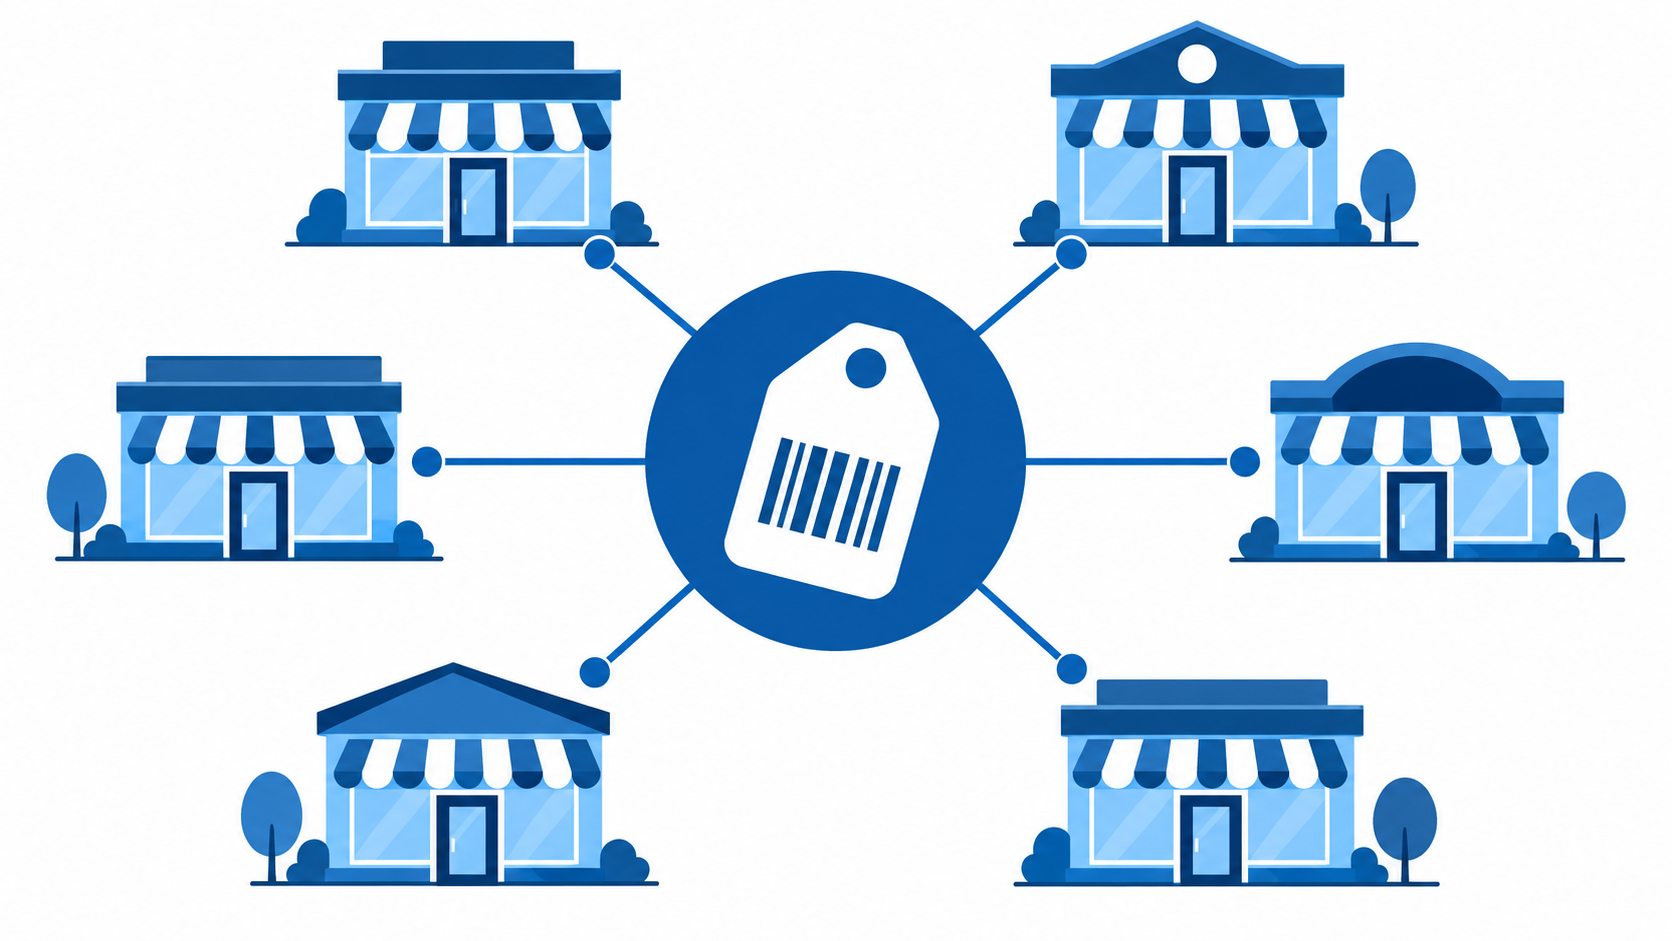
Link data by store code, not by store name.
What you can only see by looking at sales and reviews together
Sales rankings tell you which stores’ sales fell, but not where to start looking. Reviewing sales data and review data together for the same store and period lets you identify the stores that need attention first.
Stores where sales fell while negative reviews rose, stores where sales held but quality complaints keep recurring, stores where orders rose but delivery complaints increased, and stores with too few reviews that need further checking each require a different response.
Copy-and-paste prompt
Analyze the attached sales data and review data for the same stores and the same period.

1. Calculate the period-over-period change in sales, order count, and average ticket for each store.
2. Classify reviews into quality, service, cleanliness, price, wait time, and delivery.
3. Check the change in each store’s review count and share of negative reviews.
4. Find stores where a sales decline and a rise in negative reviews occurred together.
5. For stores with recurring specific complaints, keep the date and identifying details of those reviews.
6. Mark stores with too few reviews to judge as ‘Needs further review.’
7. Don’t assert a causal relationship between sales and reviews.

Separate the results as follows.
- Confirmed facts
- Possible interpretations
- Stores to check first
- Additional items to check per store
- Data missing for the analysis
There is one thing to keep in mind here. Reviews are not data that confirm the cause of a sales decline. Even if negative reviews rose around the same time sales fell, the actual cause could be the weather, trade area changes, a competitor’s promotion, or adjusted business hours. So the results at this stage should be framed as hypotheses to verify, not as confirmed causes.
Checking sales and reviews together this way gives supervisors and operations staff a practical basis for deciding which stores to inspect first and what to look at.
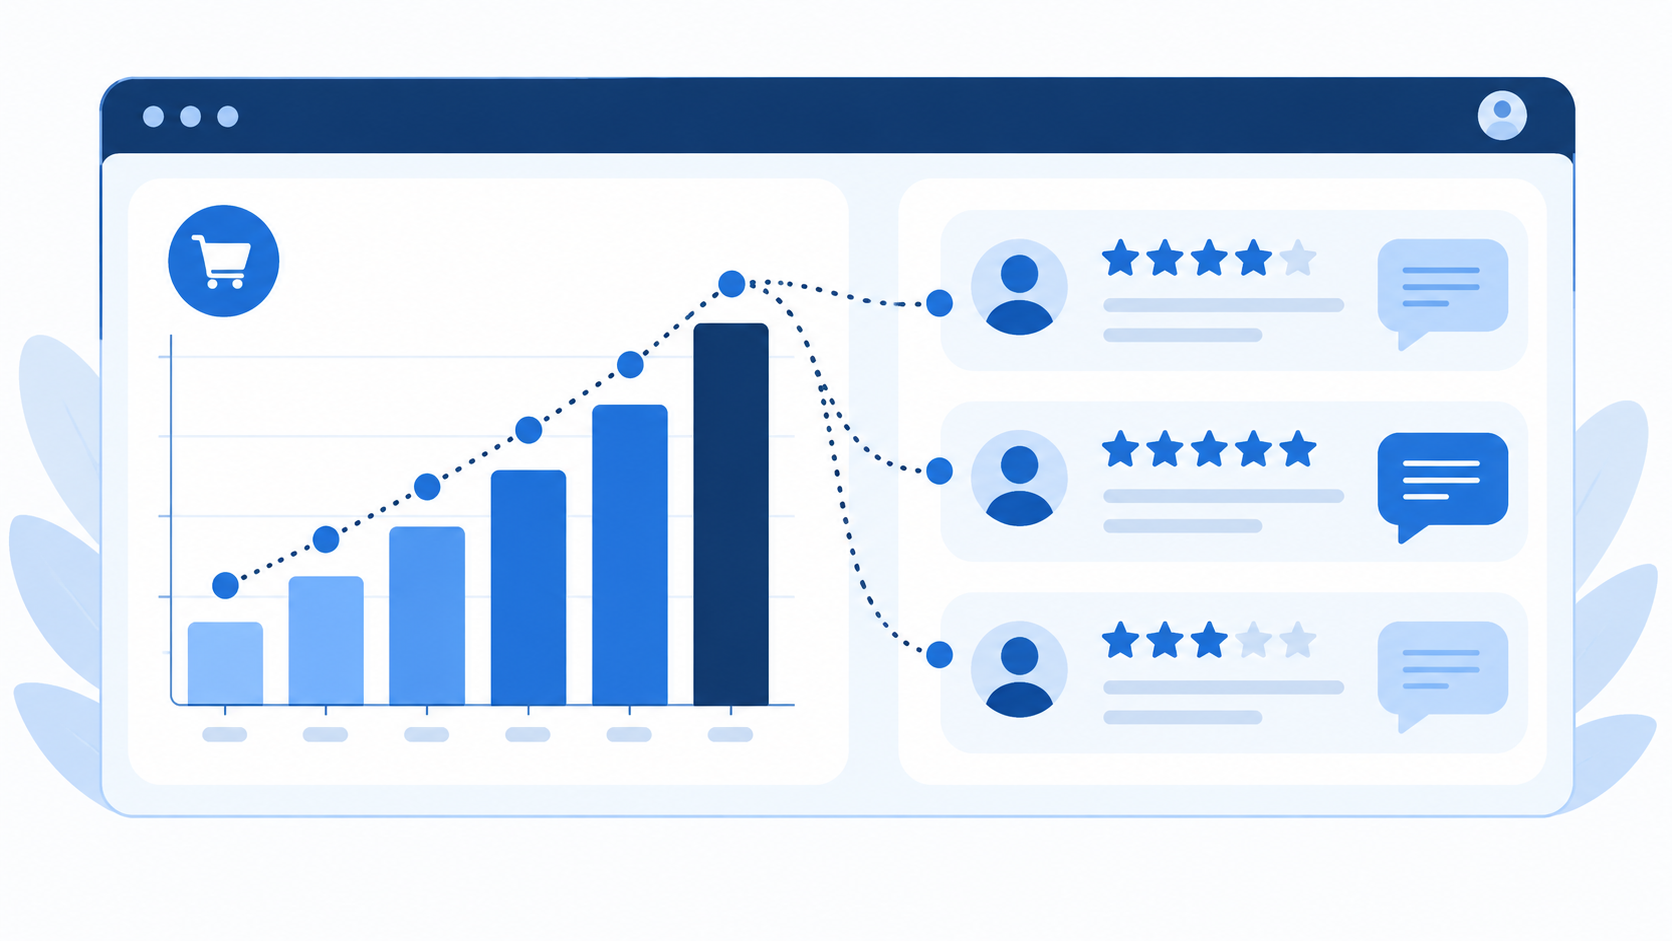
Priorities become clear when you look at sales and reviews by the same store and period.
Turning analysis into an HQ operations report, with verification before sharing
Once data cleanup and analysis are done, the remaining step is to shape the results into something usable in HQ meetings. At this stage, a structure that connects changes, evidence, and actions at a glance is what matters.
Copy-and-paste prompt
Based on the verified franchise store sales data and review analysis results,
write a weekly operations report for franchisor headquarters.

Report structure:
1. Key changes this week
2. Stores with large sales swings
3. Stores that need attention first
4. Supporting figures and review issues by store
5. Recommended actions for HQ and supervisors
6. Data to collect or verify further

Writing rules:
- Label the period for every comparison figure.
- State the calculation basis for amounts and rates of change.
- If the prior-period value is 0 or missing, don’t calculate a rate of change arbitrarily.
- Separate analysis results from estimated opinions.
- Mark anything without sufficient evidence as ‘Judgment deferred.’
- If owner and deadline information is missing, don’t make it up; leave it as ‘Assignment needed.’
- Separate what executives should review first from what staff should act on.
Once the report is done, recheck the figures and evidence rather than sharing AI’s sentences right away. There are four main things to check: whether the consolidated data total matches the original files, whether the comparison periods, weekdays, and number of operating days are the same, whether AI invented causes not found in the data, and which store’s issue each recommended action is based on.
Conclusions with vague grounds, such as “We need to strengthen service training,” rarely lead to action. A report only works as an operations report when it connects which reviews recurred at which store and who needs to check which item.
Even after the report is written, recheck sales totals and comparison conditions.
If this work repeats every week, individual prompts hit a limit
Applying the standards and prompts covered so far, you can organize sales data and draft an analysis report. The problem arises when you repeat this process every week.
If each staff member downloads sales files individually, reorganizes store names and data formats every time, checks sales and reviews on different screens, and re-explains HQ’s aggregation rules to AI every time, that is a sign your operations still depend on individual work habits.
In this situation, you can’t calculate the cost from the AI subscription fee alone. Only by adding data collection, cleanup, verification, and report compilation time do you get close to the real cost.
What you need at this point is not a more sophisticated prompt but an operating environment that consolidates sales and review data from many stores by store code and lets you query it on common HQ standards.

Weekly data preparation should be managed by a system, not by individuals.
FDAM connects sales consolidation, review lookups, and operations reporting in a single flow
FDAM, a franchise ERP, supports POS sales aggregation for franchise stores through its HQ operations management features. As sales data scattered across stores is linked to store information managed on common HQ standards, staff no longer have to re-align store names or aggregation rules each time.
Mapped to the workflow above, it looks like this: collecting each store’s sales file by hand becomes FDAM’s POS sales aggregation, and reorganizing store names and aggregation rules every time becomes common HQ store information management. With QSCV (Quality, Service, Cleanliness, Value) inspection results managed alongside, you can review sales figures and field inspection records within the same system.
Reviewing review data can be connected to FDAM’s optional CS management feature. Gathering inquiry and complaint histories scattered across channels on HQ’s terms builds up organized material you can reference alongside sales changes. That said, it is safer to use this data to identify stores that need attention first rather than to pin down causes.
FDAM is designed to connect the entire HQ workflow, from franchise startup consultations to franchise agreements, opening preparation, and store operations, with the aim of reducing the scattering of sales and operations data across different screens and staff. Drawing on long experience building software for franchises, MS Benter works with each headquarters to design a data management structure that fits its day-to-day work.
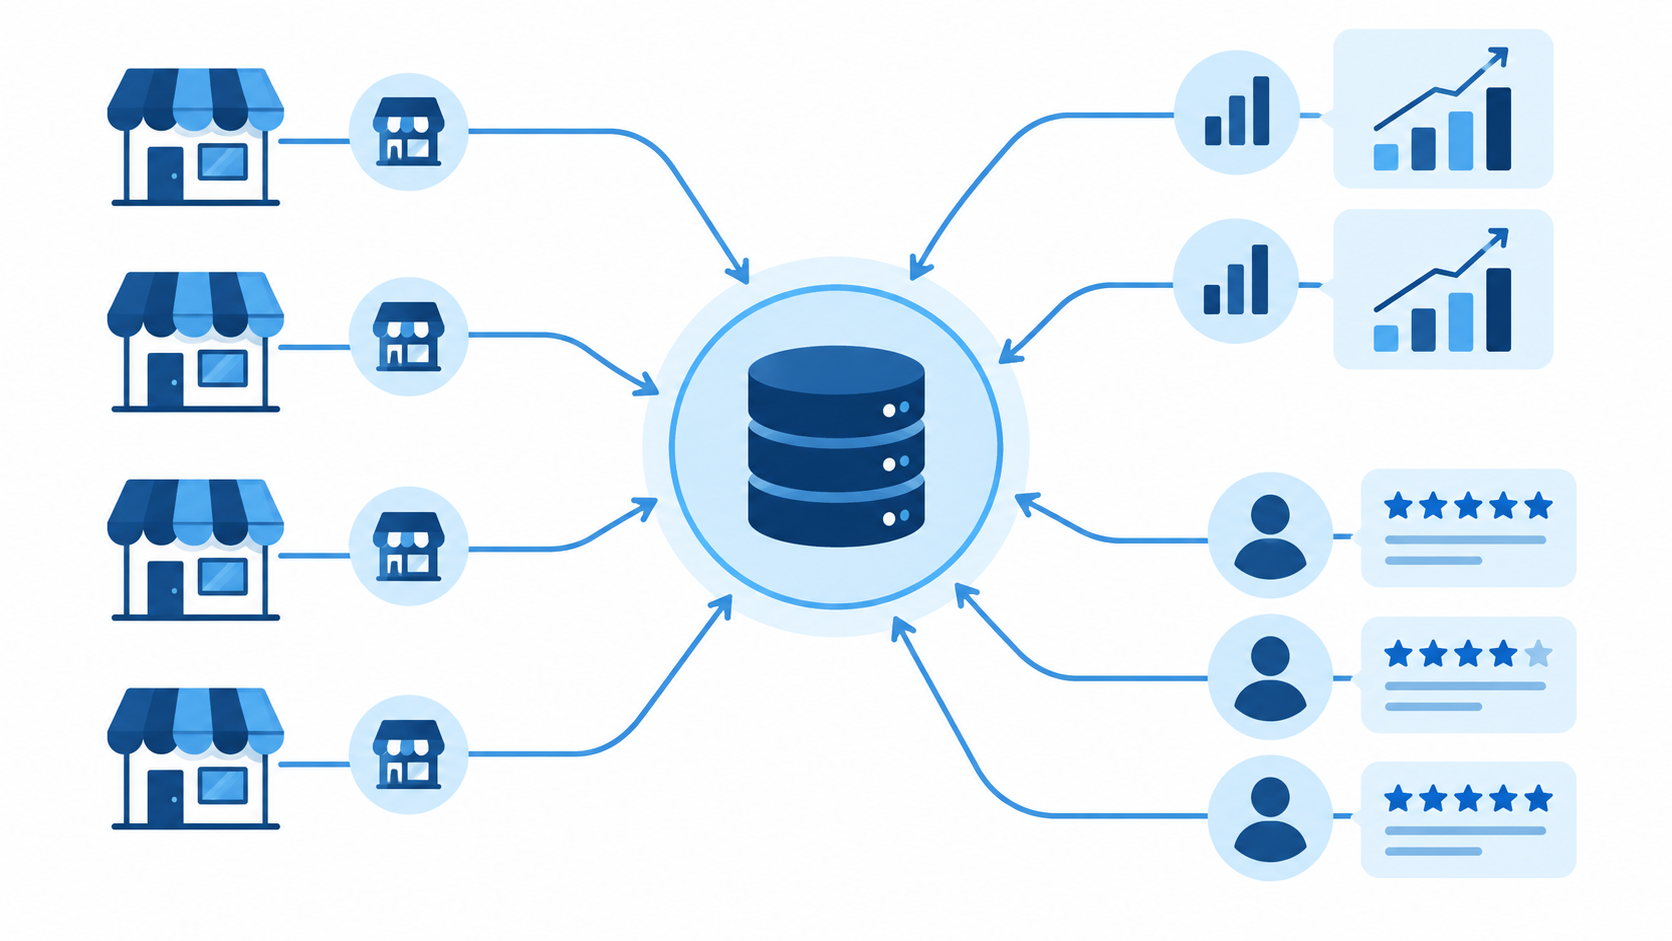
FDAM’s operations management links POS sales aggregation and store information on a single standard.
Frequently asked questions
Q1. What should you check first when analyzing franchise store sales with AI?
First, standardize the common code that identifies each store and the definition of sales (gross order value or actual payments, whether cancellations and refunds are included, and so on). If these standards differ, the same data can produce different analysis results.
Q2. Can review data confirm the cause of a sales decline?
No. Reviews do not confirm the cause of sales changes; they are closer to clues that tell you which stores to check first. The actual cause should be verified on site.
Q3. Can you use an operations report written by AI as-is?
It is safer to use it after checking that total sales match the original data, that comparison periods and operating-day conditions are the same, and that AI did not invent causes not found in the data.
Q4. How can you reduce repetitive weekly sales reporting work?
Rather than relying on individual prompts and file-cleanup habits, the fundamental fix is an operating environment that consolidates sales and review data by store code and lets you query it on common HQ standards.
Analyzing franchise store sales with AI starts not with crafting a better prompt, but with first organizing the data standards headquarters manages. Store codes, reporting periods, and sales definitions must be unified so that you get the same results even when staff change.
Based on your current sales management approach and review channels,
see what data FDAM can consolidate for you
When you contact us, let us know the sales system you currently use, the number of stores you manage, and the review channels you need to check,
and we can review the scope you need in concrete terms.
Franchise store sales analysis, Franchise AI, Franchise store data management, FDAM, Franchise ERP, Sales data consolidation, POS sales aggregation, Franchise store review management, Franchisor headquarters, Operations management system, Franchise store operations report, Franchise data