
This article explains why franchise headquarters must shift from sales‑centric management to a profit‑focused system that tracks each franchise location’s cost of goods, delivery fees, promotional spend, royalties, receivables, and settlement amounts
FRANCHISE INSIGHT · PROFIT MANAGEMENT
Franchise headquarters, it’s time to
manage franchisee profitability
In an era where franchise location profitability is wavering, a headquarters’ competitive edge lies in building a profit structure that keeps existing stores thriving longer, not just opening new ones

CORE SUMMARY
Franchise headquarters executives hear this on the ground a lot these days: “Sales look up, but why are franchisees saying it’s getting harder?” The answer is no longer a gut feeling—it’s backed by numbers. In 2024, average annual sales per restaurant reached KRW 250.26 million, a 41.4% increase over 2021, yet operating margins fell to 8.7%. Sales grew, but the bottom line shrank.
Data source: Ministry of Agriculture, Food and Rural Affairs, 2025 Restaurant Industry Management Survey, Fair Trade Commission, 2025 Franchise Business Statistics
In a single sentence,
Franchisor headquarters must shift franchise location management from simply tracking sales volume to managing how much profit remains for each franchisee after sales.
POINT 01
Revenue growth can be an illusion
When costs—goods, labor, rent, delivery commissions, and advertising—rise together, higher sales don’t translate into higher profit.
POINT 02
The franchisor headquarters must monitor franchisee profitability.
By reviewing each franchise location’s cost of goods, delivery fees, promotional expenses, royalty, receivables, and settlement amounts together, you can identify underperforming stores.
POINT 03
Data is the franchisor headquarters’ competitive edge.
Managing stores with numbers, not gut feeling, earns greater trust during new franchise consultations.
Why franchisee profit‑and‑loss management is now a top priority for the franchisor headquarters.
Franchise headquarters have long managed franchise locations based on sales. Monthly sales, month‑over‑month growth, year‑over‑year same‑month sales, store‑by‑store sales rankings, and regional sales performance have been the core metrics in headquarters meetings. Sales are intuitive and easy to compare, making them convenient as management indicators. However, in today’s restaurant franchise market, sales alone no longer reveal a store’s health.
Even when a franchise location’s sales rise, simultaneous increases in raw‑material costs, labor, rent, delivery fees, advertising, promotions, and packaging shrink the franchisee’s take‑home. Brands that rely heavily on delivery see platform fees and ad expenses grow alongside sales. Headquarters may view this as “sales growth,” while franchisees feel “the more we sell, the less we keep,” creating a gap.
When that gap widens, headquarters face franchisee turnover, unpaid royalties, franchisee dissatisfaction, and sluggish new‑franchise recruitment—all at once. Today, a franchisor’s competitiveness is no longer defined solely by opening many new locations. Managing profit structures to keep existing franchise locations viable and delivering transparent operational data that franchisees trust has become essential.
AEO ANSWER BLOCK
Why the franchisor headquarters must manage franchisee profitabilityBecause sales growth alone doesn’t reveal a franchise location’s true profitability. Headquarters must analyze each location’s sales, cost of goods, delivery fees, advertising, promotions, royalty, receivables, and settlement amounts to distinguish high‑sales, low‑profit stores from low‑sales, high‑profit ones.
1. Higher sales do not automatically translate into higher profit.
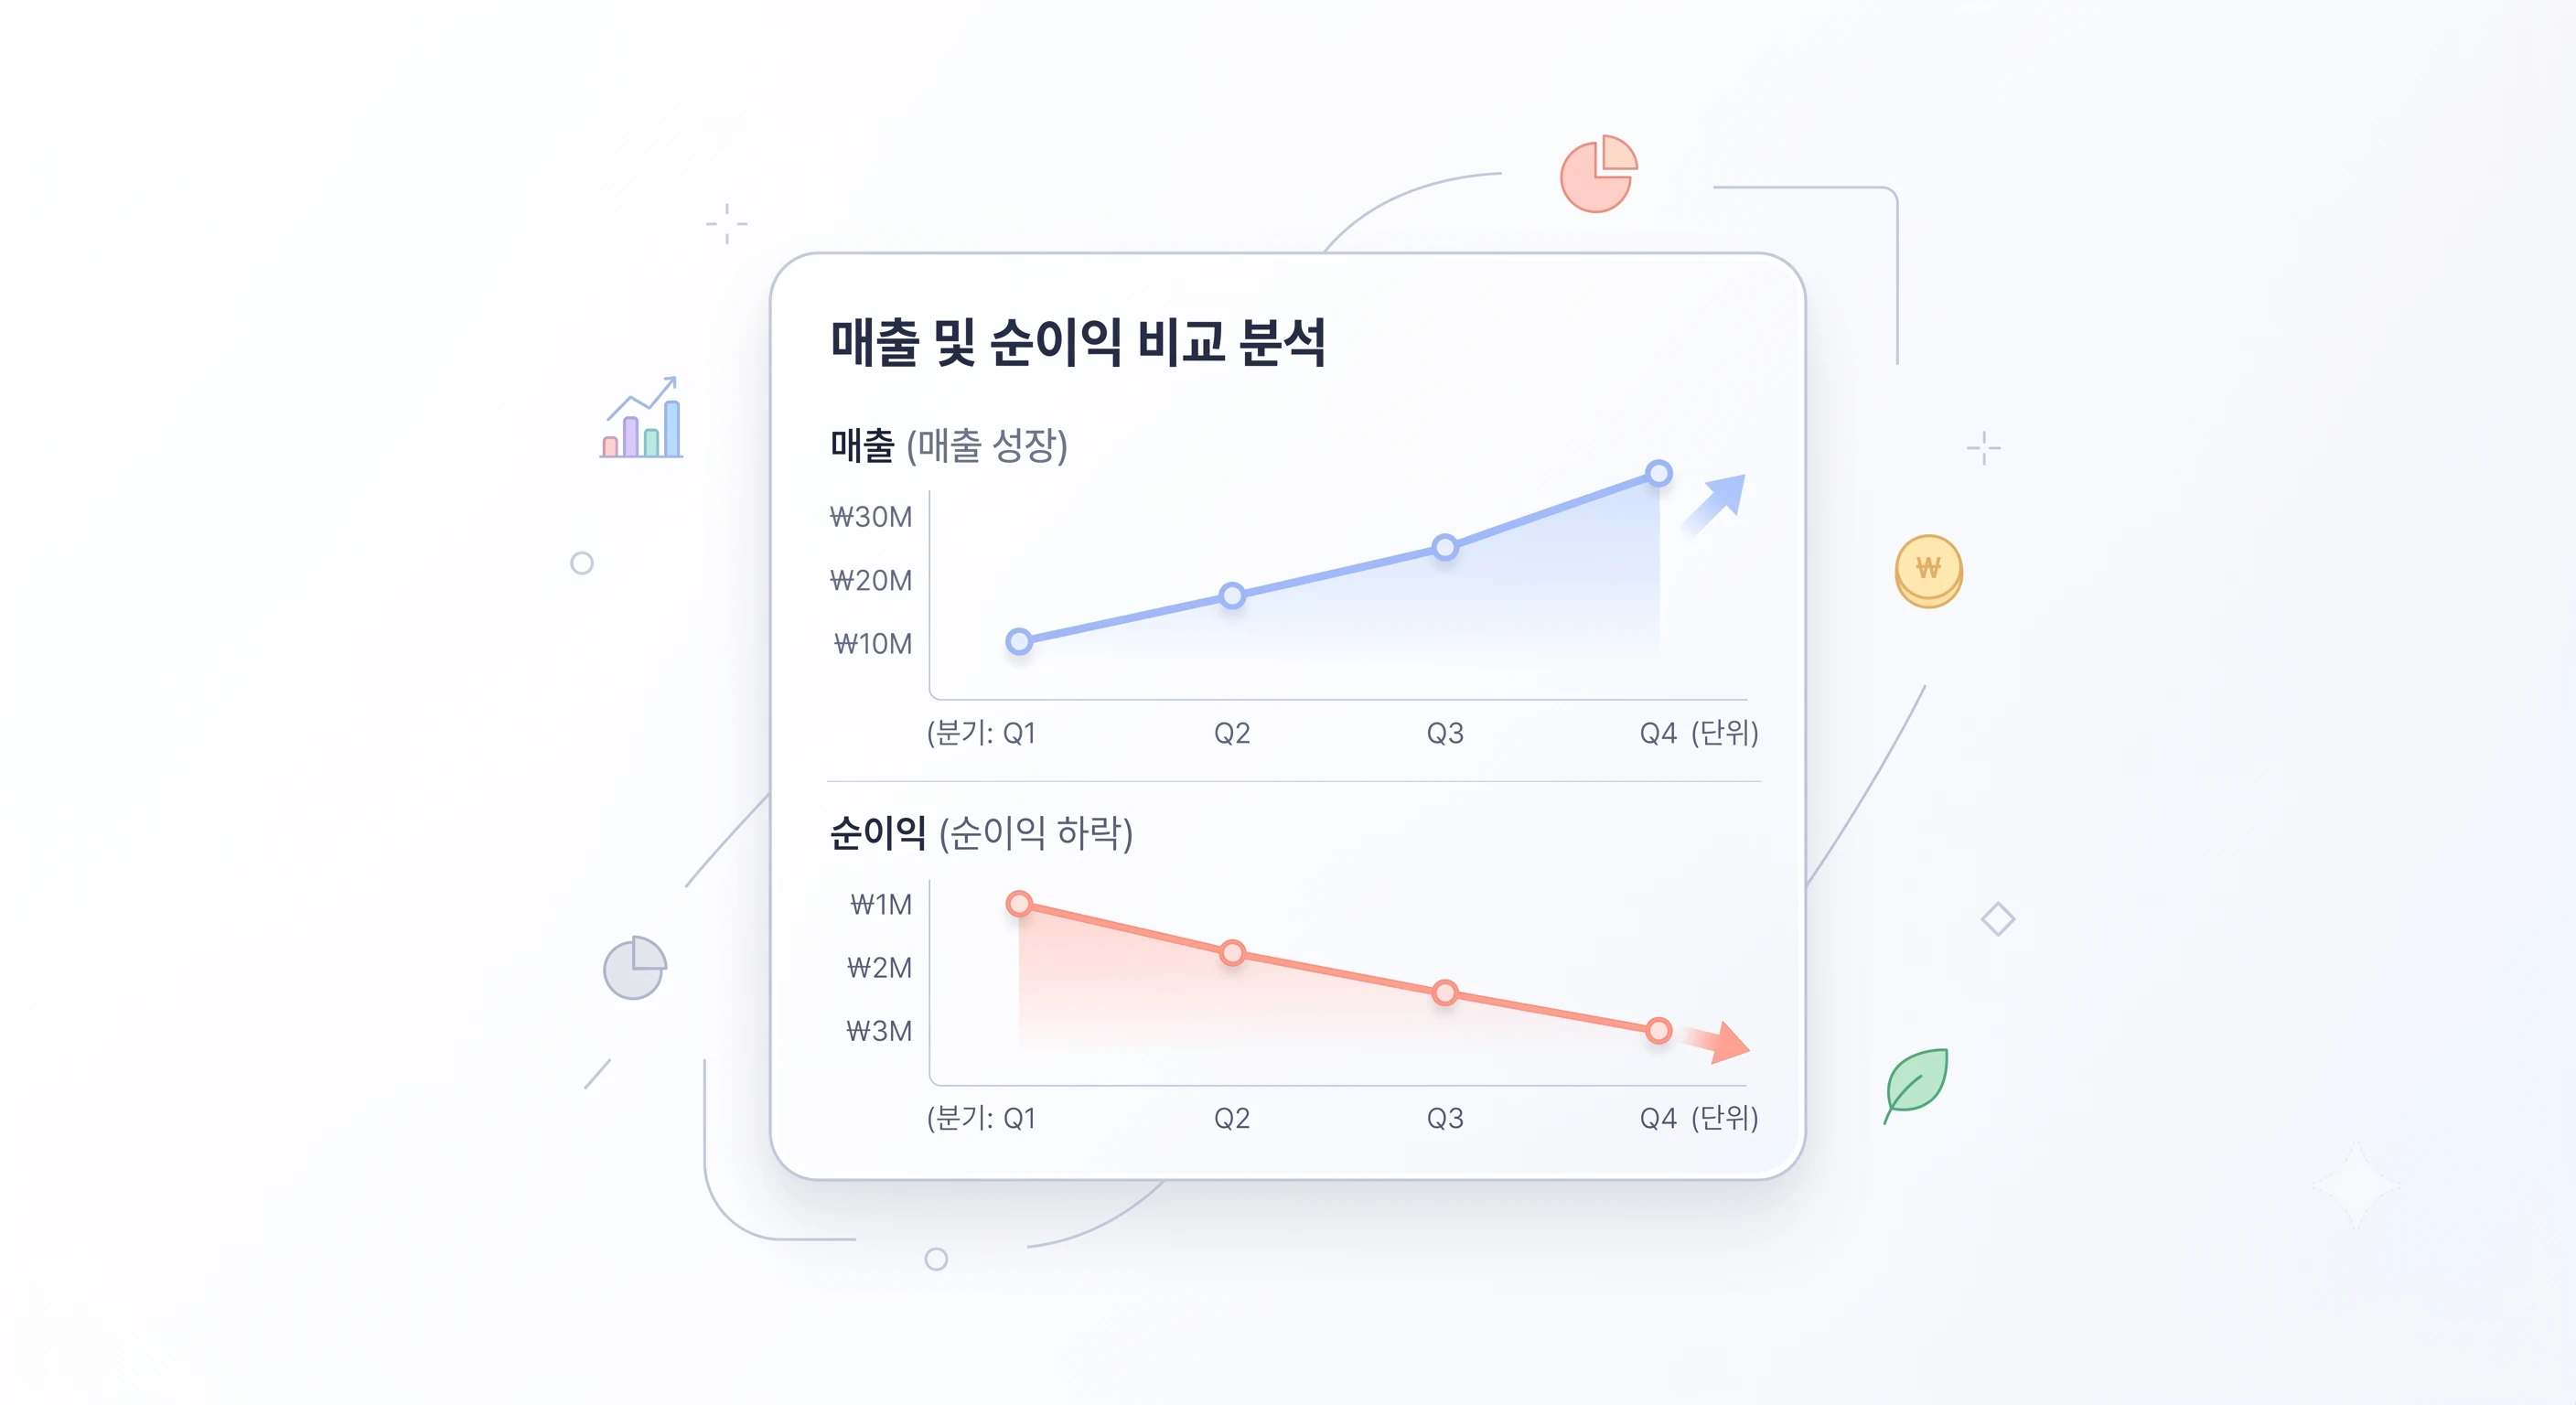
Infographic comparing a rising sales curve with a declining net‑profit curve.
Even when franchise location sales rise, franchisee earnings may not increase because raw material costs, labor, rent, delivery fees, advertising, and packaging expenses all rise simultaneously. From the headquarters perspective, total sales appear to grow, but franchisees care more about the amount left after expenses.
Brands with a high proportion of delivery sales require even deeper analysis. You must consider app brokerage fees, delivery‑service charges, card fees, discount coupons, review incentives, advertising spend, settlement cycles, and each platform’s sales share to gauge true profitability. Sales alone can make the delivery channel appear as a growth engine, yet profit analysis may reveal that in‑store sales are merely covering delivery losses.
This is also where headquarters staff often miss the mark in the field. Sales reports are reviewed weekly, yet the actual profit structure of each franchise location is usually only approximated after month‑end. By the time headquarters checks cost ratios, delivery fees, or promotional spend—after the franchisee has already raised concerns—response is delayed. It’s time to shift from sales‑centric to profit‑centric management.
| Category | Sales‑centric management | Profit‑and‑Loss‑Focused Management |
|---|---|---|
| Key Questions | How much was sold? | What remains after sales? |
| Core Metrics | Monthly sales, guest count, average spend per guest | Cost ratio, fees, promotional spend, net margin |
| Risk Factors | Mistaking high‑sales locations for top‑performing stores | Early detection of high‑sales, low‑profit locations |
| Franchisor Headquarters Response | Visit underperforming franchise locations | Targeted actions to improve profit‑and‑loss drivers |
2. The first metric franchisor headquarters should examine is the amount of money the franchisee retains.

Dashboard where franchisor staff view each franchise location’s sales, costs, royalties and settlement amounts together.
When managing franchise locations, franchisor headquarters should look beyond simple sales rankings. It must evaluate each location’s sales, cost of goods, delivery fees, promotional spend, royalties, receivables, and settlement amounts together. For restaurant franchises, profitability is judged not by total monthly sales but by how much remains for the franchisee after all actual expenses are deducted.
For example, Store A may generate high monthly sales but incur large delivery‑app advertising and discount costs, resulting in low profitability. Conversely, Store B might have modest sales yet maintain stable cost ratios and labor expenses, making it a healthier operation. Failing to distinguish these differences leads franchisor headquarters to make poor decisions. Treating high‑sales stores as top performers and low‑sales stores as merely targets for management is now a risky approach.
In reality, franchisor headquarters should focus on profit‑and‑loss risk, not sales rank. Stores with high sales but low profitability, locations where delivery sales are strong but settlement amounts are weak, franchisees repeatedly falling behind on royalty payments, or stores that invest in promotions without improving profitability all require heightened oversight. Headquarters must be able to identify these cases quickly.
Regular questions franchisor headquarters should ask
· What is the actual margin for each franchise location?
· After deducting fees and advertising costs from delivery sales, how much remains?
· Which franchise locations are accumulating unpaid royalties?
· Did sales and profitability improve together after promotional spending?
· Which franchise locations have high sales but low profitability?
3. High‑sales franchise locations aren’t always top performers.
Franchisor headquarters often make the mistake of labeling high‑monthly‑sales locations as top‑performing. However, high sales only indicate many customer orders, not that the franchisee is earning a lot. If a location relies on excessive discount coupons, spends heavily on delivery‑app advertising, or focuses on high‑cost menu items, a high‑sales location can actually be riskier.
Consider a franchise location with monthly sales of 50 million KRW. At first glance, that figure looks impressive for the headquarters to showcase. Yet if its cost‑of‑goods ratio is 42%, delivery and advertising expenses are 18%, labor and rent burdens are high, and royalty arrears keep mounting, the franchisee’s actual profit can be very low. Conversely, a location with 30 million KRW in monthly sales but stable cost ratios, a strong share of dine‑in sales, and low promotional spend may be far healthier.
If the headquarters fails to distinguish this difference, supervisor visit priorities will be misaligned. Focusing only on declining‑sales locations can cause the loss of franchisees at high‑sales, low‑profit sites. Profit‑centered management means not just “helping low‑sales locations” but “identifying franchisees whose cost structure makes sustainability difficult.”
| Comparison items | Store A: High sales, low profit | Store B: Moderate sales, high profit |
|---|---|---|
| Monthly sales | 50 million KRW | 32 million KRW |
| Cost‑of‑goods ratio | 42% | 32% |
| Delivery & advertising costs | High | Low |
| Royalty collection | Repeated receivables | Normal collection |
| Headquarters judgment | Immediate profit‑loss improvement target | Operational stability example |
4. Which profit‑loss data must the franchisor headquarters manage?
Franchisee profit‑loss management isn’t about building a complex accounting system. It means linking every core cost element the headquarters needs to evaluate franchise location performance—sales, cost of goods, royalties, delivery settlements, advertising spend, promotions, receivables, and operational history. Even with just these connections, the headquarters’ oversight improves dramatically.
Even if a franchisor headquarters can’t import the full accounting ledger from each franchise location, it can still manage the operational data directly tied to the headquarters. Typical data include raw‑material order information supplied by the headquarters, POS sales data, royalty billing data, receivables, settlement data from each delivery platform, promotion‑support details, and supervisor visit logs. When this data is aggregated per franchise location, the overall profit‑loss trend becomes clear.
| Data elements | Items to verify | Headquarters usage |
|---|---|---|
| Sales data | Monthly sales, daily sales, sales by channel, sales by menu item | Growth rate and sales structure analysis |
| Cost data | Order amount by item, cost ratio, material cost fluctuations | Analysis of profitability decline causes |
| Delivery settlement | Revenue, fees, advertising spend, and discount costs by platform | Verify the actual profit and loss of delivery channels |
| Royalty | Billed amount, collected amount, outstanding receivables, and delinquency period | Manage franchisee burden and franchisor headquarters profit stability |
| Promotional expenses | Coupons, discounts, advertising, and headquarters support funds | Assess profit and loss improvement after promotions |
| Operational history | Supervisor visits, improvement requests, and franchisee consultations | Manage response history for problem franchise locations |
5. Delivery revenue must always be reviewed on a settlement basis
Delivery revenue is the area most prone to misunderstanding between franchisor headquarters and franchise locations. It appears as sales in the POS, but during settlement the platform fees, advertising spend, discount costs, delivery fees, card fees, and VAT-related items are deducted. Consequently, even high delivery sales can result in a lower actual deposit than expected.
To manage delivery revenue effectively, the headquarters must separate platform-specific sales from settlement amounts. Fee structures and advertising products differ across platforms such as Baedal Minjok, Coupang Eats, and Yogiyo, and each store uses its own coupons and promotion tactics. Even a store with a monthly sales figure of 30 million KRW can see vastly different franchisee profitability depending on which platforms and how heavily they are used.
When the headquarters funds promotions, it should not look solely at sales growth. If sales rise after coupons and advertising spend but profitability declines, the promotion cannot be deemed successful. Going forward, marketing performance metrics must shift from “how much sales increased” to “whether profit and loss improved together.”
Common issues in delivery revenue management
· Relying only on POS sales without verifying actual deposits
· Not separating platform fees from advertising spend
· Treating coupon and discount costs solely as sales growth expenses
· Failing to check royalty arrears or settlement delays after delivery sales increase
6. Royalties and delinquent balances serve as the franchisor headquarters’ profit‑and‑loss warning lights.
From the franchisor headquarters perspective, royalties are not just a revenue line item. They are a key signal of franchise location operating health. If royalties remain unpaid repeatedly even though sales are normal, it likely means the franchisee’s profit‑and‑loss is already under pressure. The headquarters should view delinquent balances not merely as a receivable issue but as an early warning of store profitability deterioration.
Especially when royalties are tied to sales, the higher the sales, the larger the headquarters’ claim. However, if a franchisee’s profitability is slipping and the royalty burden grows, delinquencies can mount and franchisee dissatisfaction can rise. Conversely, a flat‑rate royalty can become a fixed‑cost strain for stores with weak sales. Regardless of the model, the headquarters must examine royalty charges, collections, delinquencies, aging periods, and store profit‑and‑loss data together.
Stores with recurring delinquencies are not just collection targets; they require root‑cause analysis. Determine whether declining sales, rising costs, delayed delivery settlements, or promotional expense burdens are driving the issue. By pinpointing the cause with data, the headquarters can discuss realistic solutions with the franchisee.
| Delinquency Types | Possible Causes | Headquarters Response |
|---|---|---|
| One‑Time Delinquency | Settlement schedule mismatch, short‑term cash‑flow issues | Verify settlement date, adjust collection schedule |
| Recurring Delinquency | Franchisee profit‑and‑loss deterioration, fixed‑cost burden | Profit‑and‑loss diagnosis, cost‑structure analysis |
| High‑Sales Delinquency | Excess delivery/advertising spend, rising cost‑of‑goods ratio | Re‑evaluate profitability by channel |
| Long‑Term Delinquency | Reduced operational sustainability | Contract and operational risk management |
7. A supervisor’s experience becomes powerful when combined with data.
In the field, supervisors are the key to franchise location management. They handle store visits, franchisee consultations, operational training, quality checks, and sales‑improvement recommendations. The problem is that a single supervisor overseeing multiple locations can’t keep every location’s profit‑and‑loss structure in mind.
An experienced supervisor can spot issues just by the store atmosphere and the franchisee’s attitude. But if the entire franchisor headquarters’ operating system relies on a supervisor’s gut, quality will slip when staff change, store count grows, or regions expand. Without data, even the best supervisor’s know‑how can’t become an organizational asset.
Supervisors must shift from gut‑based managers to data‑driven consultants for the franchisor headquarters. Instead of saying, “Sales are down, let’s work harder,” they should say, “Last month delivery ad spend rose 18 % and cost‑of‑goods increased 4 percentage points, lowering net margin. Let’s adjust the menu mix and promotion strategy together.”
Key Insight
A good supervisor doesn’t replace data; they become stronger with it. Data surfaces problems quickly, and the supervisor interprets the cause on the ground and turns it into action.
8. FDAM consolidates franchise location operating data in one place
FDAM ERP DASHBOARD
Sales · Royalties · Receivables · Settlement Overview
Franchise location
Royalties
Receivables
Gangnam location
Billing complete
0 KRW
Songdo location
Billing complete
1.2 M KRW
Bucheon location
Under review
350 K KRW
franchise locations with profit risk
6 locations
franchise locations with outstanding receivables
3 locations
Dashboard that consolidates sales, royalties, receivables, and delivery settlement data within the franchise ERP interface
FDAM is an ERP solution that helps franchisor headquarters systematically manage franchise location operating data. The key for headquarters is keeping data from being scattered. Sales reside in POS records, delivery settlements are split by platform, royalties are calculated in Excel, and receivables are managed separately by staff, making accurate decisions difficult.
FDAM focuses on organizing these operating data from the headquarters perspective. By viewing each franchise location’s sales flow, royalty billing, collection status, receivables, and operational history in one place, staff can quickly pinpoint problem locations—stores where sales are up but royalty receivables repeatedly lag, locations with high delivery sales but low settlement amounts, or stores that saw a post‑promotion sales boost without real profit improvement.
As this data accumulates, franchisor headquarters will manage franchise locations based on evidence, not intuition. When a supervisor visits a store, they can offer improvement recommendations grounded in each franchise location’s data rather than vague advice. Franchisees also gain confidence that the headquarters understands the situation through numbers.
| Headquarters challenges | FDAM management approach |
|---|---|
| Franchise location profitability is hard to view at a glance | Integrate sales, cost of goods, settlements, royalties, and receivables by franchise location |
| Royalty calculations and collection management are scattered across Excel | Manage billed amounts, collections, receivables, and delinquency history on a single screen |
| Difficult to identify gaps between delivery settlements and actual sales | Compare platform‑specific settlement flows with each franchise location’s net profit structure |
| Supervisor visit records remain only with the individual staff member | Accumulate store‑level consultations, improvement requests, and action outcomes as headquarters assets |
| Problematic franchise locations are identified after the fact | Early detection of warning signs such as profit decline, recurring receivables, and settlement drops |
9. The franchisor headquarters’ management standards must also change.
MANAGEMENT SHIFT
BEFORE
Revenue‑focused
Franchise location management based on monthly sales, sales rankings, and month‑over‑month growth rates
AFTER
Profit‑and‑loss‑focused
Operational management that links costs, fees, royalties, receivables, and settlement amounts
Step‑by‑step infographic showing the shift of franchise location management standards from revenue‑focused to profit‑and‑loss‑focused
Going forward, the franchisor headquarters’ management criteria must shift from “how much was sold” to “how much was retained.” This change isn’t limited to internal operations; it also ties into franchise location recruitment, franchisee training, supervisor management, marketing strategy, and royalty policies.
The same applies during franchise location recruitment. Previously, the emphasis was on average monthly sales, startup costs, and payback periods. Today, prospective franchisees ask more detailed questions such as, “What is the cost‑of‑goods ratio?”, “What’s the net profit after delivery fees?”, “How is the royalty calculated?”, and “How does the headquarters support store management?”
Answering these questions requires the headquarters to have operational data. Simply showcasing success stories isn’t enough; a data‑driven headquarters earns more trust. FDAM provides the foundation for the headquarters to manage franchise location operational data and leverage it in communications with franchisees.
10. Franchisee Profit‑and‑Loss Management Checklist
The checklist below serves as a practical benchmark for the franchisor headquarters to assess how systematically it manages franchise location profit and loss. It’s more important that data are linked at the store level than merely collected. Even with sales data, profit‑and‑loss management is incomplete if costs, settlements, royalties, and receivables aren’t connected.
| Category | Checklist Question | Verification Data |
|---|---|---|
| 01 | Are monthly sales broken down by franchise location and by channel? | POS and delivery platform sales |
| 02 | Can you view cost ratios by franchise location and order amounts by item? | order data, item cost |
| 03 | Are platform-specific differences between delivery sales and actual settlement amounts being tracked? | delivery settlement, fees, advertising costs |
| 04 | Do you manage royalty invoices, collections, and receivables by franchise location? | royalty billing and collection history |
| 05 | After spending promotional costs, do you verify not only sales but also profit improvement? | coupons, advertising spend, promotion results |
| 06 | Do you separately categorize high‑sales, low‑profit franchise locations? | net margin and expense ratios relative to sales |
| 07 | Are supervisor visit records linked to profit‑improvement outcomes? | visit logs, action items, improvement metrics |
Limitations of Excel management: numbers exist but aren’t connected.
Many franchisor headquarters start by tracking franchise location sales and royalties in Excel. When the number of locations is small, Excel is fast and convenient. As the network grows and delivery platforms, settlement items, royalty policies, promotional spend, and receivables become more complex, Excel quickly hits its limits.
The biggest problem is that data ends up scattered across separate files. Sales files, royalty files, receivable files, supervisor‑visit logs, and delivery‑settlement files all exist independently, forcing staff to compare them manually each time. When file versions change or staff turnover occurs, extra time is spent confirming which data set is current.
Profit‑and‑loss management hinges on linking data. If sales rise but receivables also increase, you need to investigate why. If delivery sales grow but the actual settlement amount is low, you must examine fees and advertising costs. If promotional spend doesn’t improve profitability, the promotion strategy must be revised. In Excel, these connections have to be built manually every time.
Common issues with Excel‑based management
· Different staff enter store names, codes, and royalty criteria inconsistently
· Sales, settlements, royalties, and receivables are not linked
· Multiple files must be opened to pinpoint why a franchise location’s profit is deteriorating
· Supervisor‑visit records are separated from actual improvement outcomes
· Every time a report for senior management is prepared, the same manual steps are repeated
Managing franchisee profit‑and‑loss is also critical for marketing
Profit‑and‑loss management isn’t just the operations team’s job. It directly influences franchise location recruitment and brand marketing. Prospective franchisees now prioritize operational stability over simple sales examples. They want to know, not just “what’s the monthly revenue,” but “how much profit actually remains,” “what data the franchisor headquarters uses to manage stores,” and “how royalties and cost structures are configured.”
When the franchisor maintains profit‑and‑loss data for each franchise location, recruitment conversations become far more persuasive. You can discuss not only high‑sales success stories but also the operating models of financially stable stores, cost‑control benchmarks, channel‑specific profitability, and the franchisor’s management processes.
This isn’t exaggerated advertising—it’s a trust issue. Prospective owners are becoming increasingly savvy. Brand recognition matters, but how systematically the franchisor manages its franchise locations is a decisive factor. A franchisor with solid profit‑and‑loss data can craft a stronger recruitment message.
How questions change during franchise consultations
· “What’s the monthly sales figure?” → “What’s the net amount after delivery fees and cost of goods?”
· “What’s the startup cost?” → “How is the payback period calculated based on profit metrics?”
· “Does the franchisor provide support?” → “What data does the franchisor use to manage stores?”
· “Are there any successful locations?” → “What common traits do long‑running, stable stores share?”
30‑day action plan every franchisor should start now
Managing franchisee profit‑and‑loss isn’t a one‑time project. Trying to integrate every data point perfectly from day one only delays the start. The franchisor should first define core metrics and create comparable benchmarks for each franchise location. The 30‑day action plan below serves as a launchpad for shifting from sales‑centric to profit‑centric management.
Week 1: Identify Data Locations
Consolidate where sales, royalties, receivables, delivery settlements, promotion expenses, and supervisor records are stored.
Week 2: Standardize Store Code Criteria
Unify store name, store code, region, and responsible supervisor so that all data aligns to a single franchise location reference.
Week 3: Set Profit‑Loss Risk Indicators
Define key warning metrics for the franchisor headquarters such as cost ratio, delivery cost ratio, receivables, promotion expense share, and settlement amount decline rate.
Week 4: Prioritize Problematic Stores
Classify high‑sales, low‑profit locations, repeatedly delinquent locations, stores with declining delivery settlements, and stores overspending on promotions, then define corrective actions.
A franchise location must endure for the brand to endure.
The franchisor headquarters’ competitive edge now comes from its ability to keep franchise locations operating profitably over time, not from sheer store count. Even if many locations are opened quickly, the brand cannot sustain longevity if existing stores lose profitability. Rising closures erode new entrepreneurs’ confidence and drive up internal operating costs for headquarters.
Managing franchise location profitability isn’t a perk for franchisees—it’s a survival strategy for the franchisor headquarters. When franchisees operate stably, royalties are collected reliably, brand quality is maintained, and strong case studies emerge in new franchise discussions. Headquarters overseeing profitability means both parties are looking at the same numbers and moving in the same direction.
FDAM enables franchisor headquarters to manage franchise locations with data, not intuition. By consolidating sales, royalties, receivables, and operational history in one place, headquarters can spot issues faster and intervene more precisely. Managing well beats selling well—that’s the core capability franchisor headquarters needs today.
Frequently Asked Questions
Q: Isn’t looking at sales enough for franchise location management?
A: No. Even high sales can mask low profitability if cost of goods, delivery fees, advertising spend, royalty structure, or receivables are unfavorable. Headquarters must evaluate costs and settlement amounts alongside sales to identify high‑sales, low‑profit locations.
Q: To what extent should the franchisor headquarters manage franchisee profitability?
A. This does not mean the franchisor headquarters takes over every franchisee’s accounting ledger. The key is linking sales, orders, royalties, receivables, delivery settlements, promotional expenses, and supervisor history to each franchise location so you can make operational decisions.
Q. Which franchisor headquarters benefit most from FDAM?
A. It’s ideal for headquarters that struggle to track sales, royalties, receivables, and operational history in Excel as the number of franchise locations grows. It’s especially valuable for brands with high delivery sales, complex platform settlements, or critical royalty and receivable management.
Q. Why is franchisee profit‑and‑loss management important for marketing?
A. Because showing operational stability and the franchisor headquarters’ management system is now a more persuasive selling point than raw sales when recruiting franchise locations. Prospective franchisees ask about monthly revenue as well as cost ratios, delivery fees, royalties, and the actual profit structure.
Q. Isn’t a store with high delivery sales automatically a good store?
A. Not necessarily. Delivery sales include fees, advertising costs, discounts, and delivery charges, so you must verify the net settlement amount and profit‑and‑loss. A high delivery volume with low net settlement and high cost ratios can signal a risky store.
Q. Why is royalty receivable a profit‑and‑loss metric?
A. Outstanding royalties may indicate that a franchisee’s cash flow is weakening. Repeated receivables despite sales suggest rising costs, delivery fee burdens, settlement delays, or excessive promotional spending, all of which affect profitability.
Q. Isn’t Excel sufficient for management?
A. Excel works at the start, but as the number of franchise locations expands, sales, royalties, receivables, delivery settlements, and operational logs become scattered across multiple files. Profit‑and‑loss oversight relies on linked data, so a system that consolidates information by franchise location is essential.
FRANCHISE MANAGEMENT · FDAM
Your current franchise locations,
managing franchise locations by profit‑and‑loss instead of just sales?
A franchisor’s competitiveness is no longer measured by the number of franchise locations but by
the ability to keep franchise locations operating successfully over the long term.
If you want to manage sales, royalties, receivables, settlements, and operational history in a single platform, use FDAM to evaluate and streamline your headquarters’ franchise location management.
Request a deployment consultation