
This outlines why franchisor headquarters should view Baemin, Coupang Eats, Yogiyo, etc., not by platform but aggregated by franchise location, period, and platform, and how to leverage FDAM.
FRANCHISE INSIGHT · DELIVERY SALES DASHBOARD
Franchisor headquarters,
Why integrated delivery‑app sales view is essential
Moving beyond separate views of Baemin, Coupang Eats, and Yogiyo, headquarters must manage delivery sales flow by franchise location.
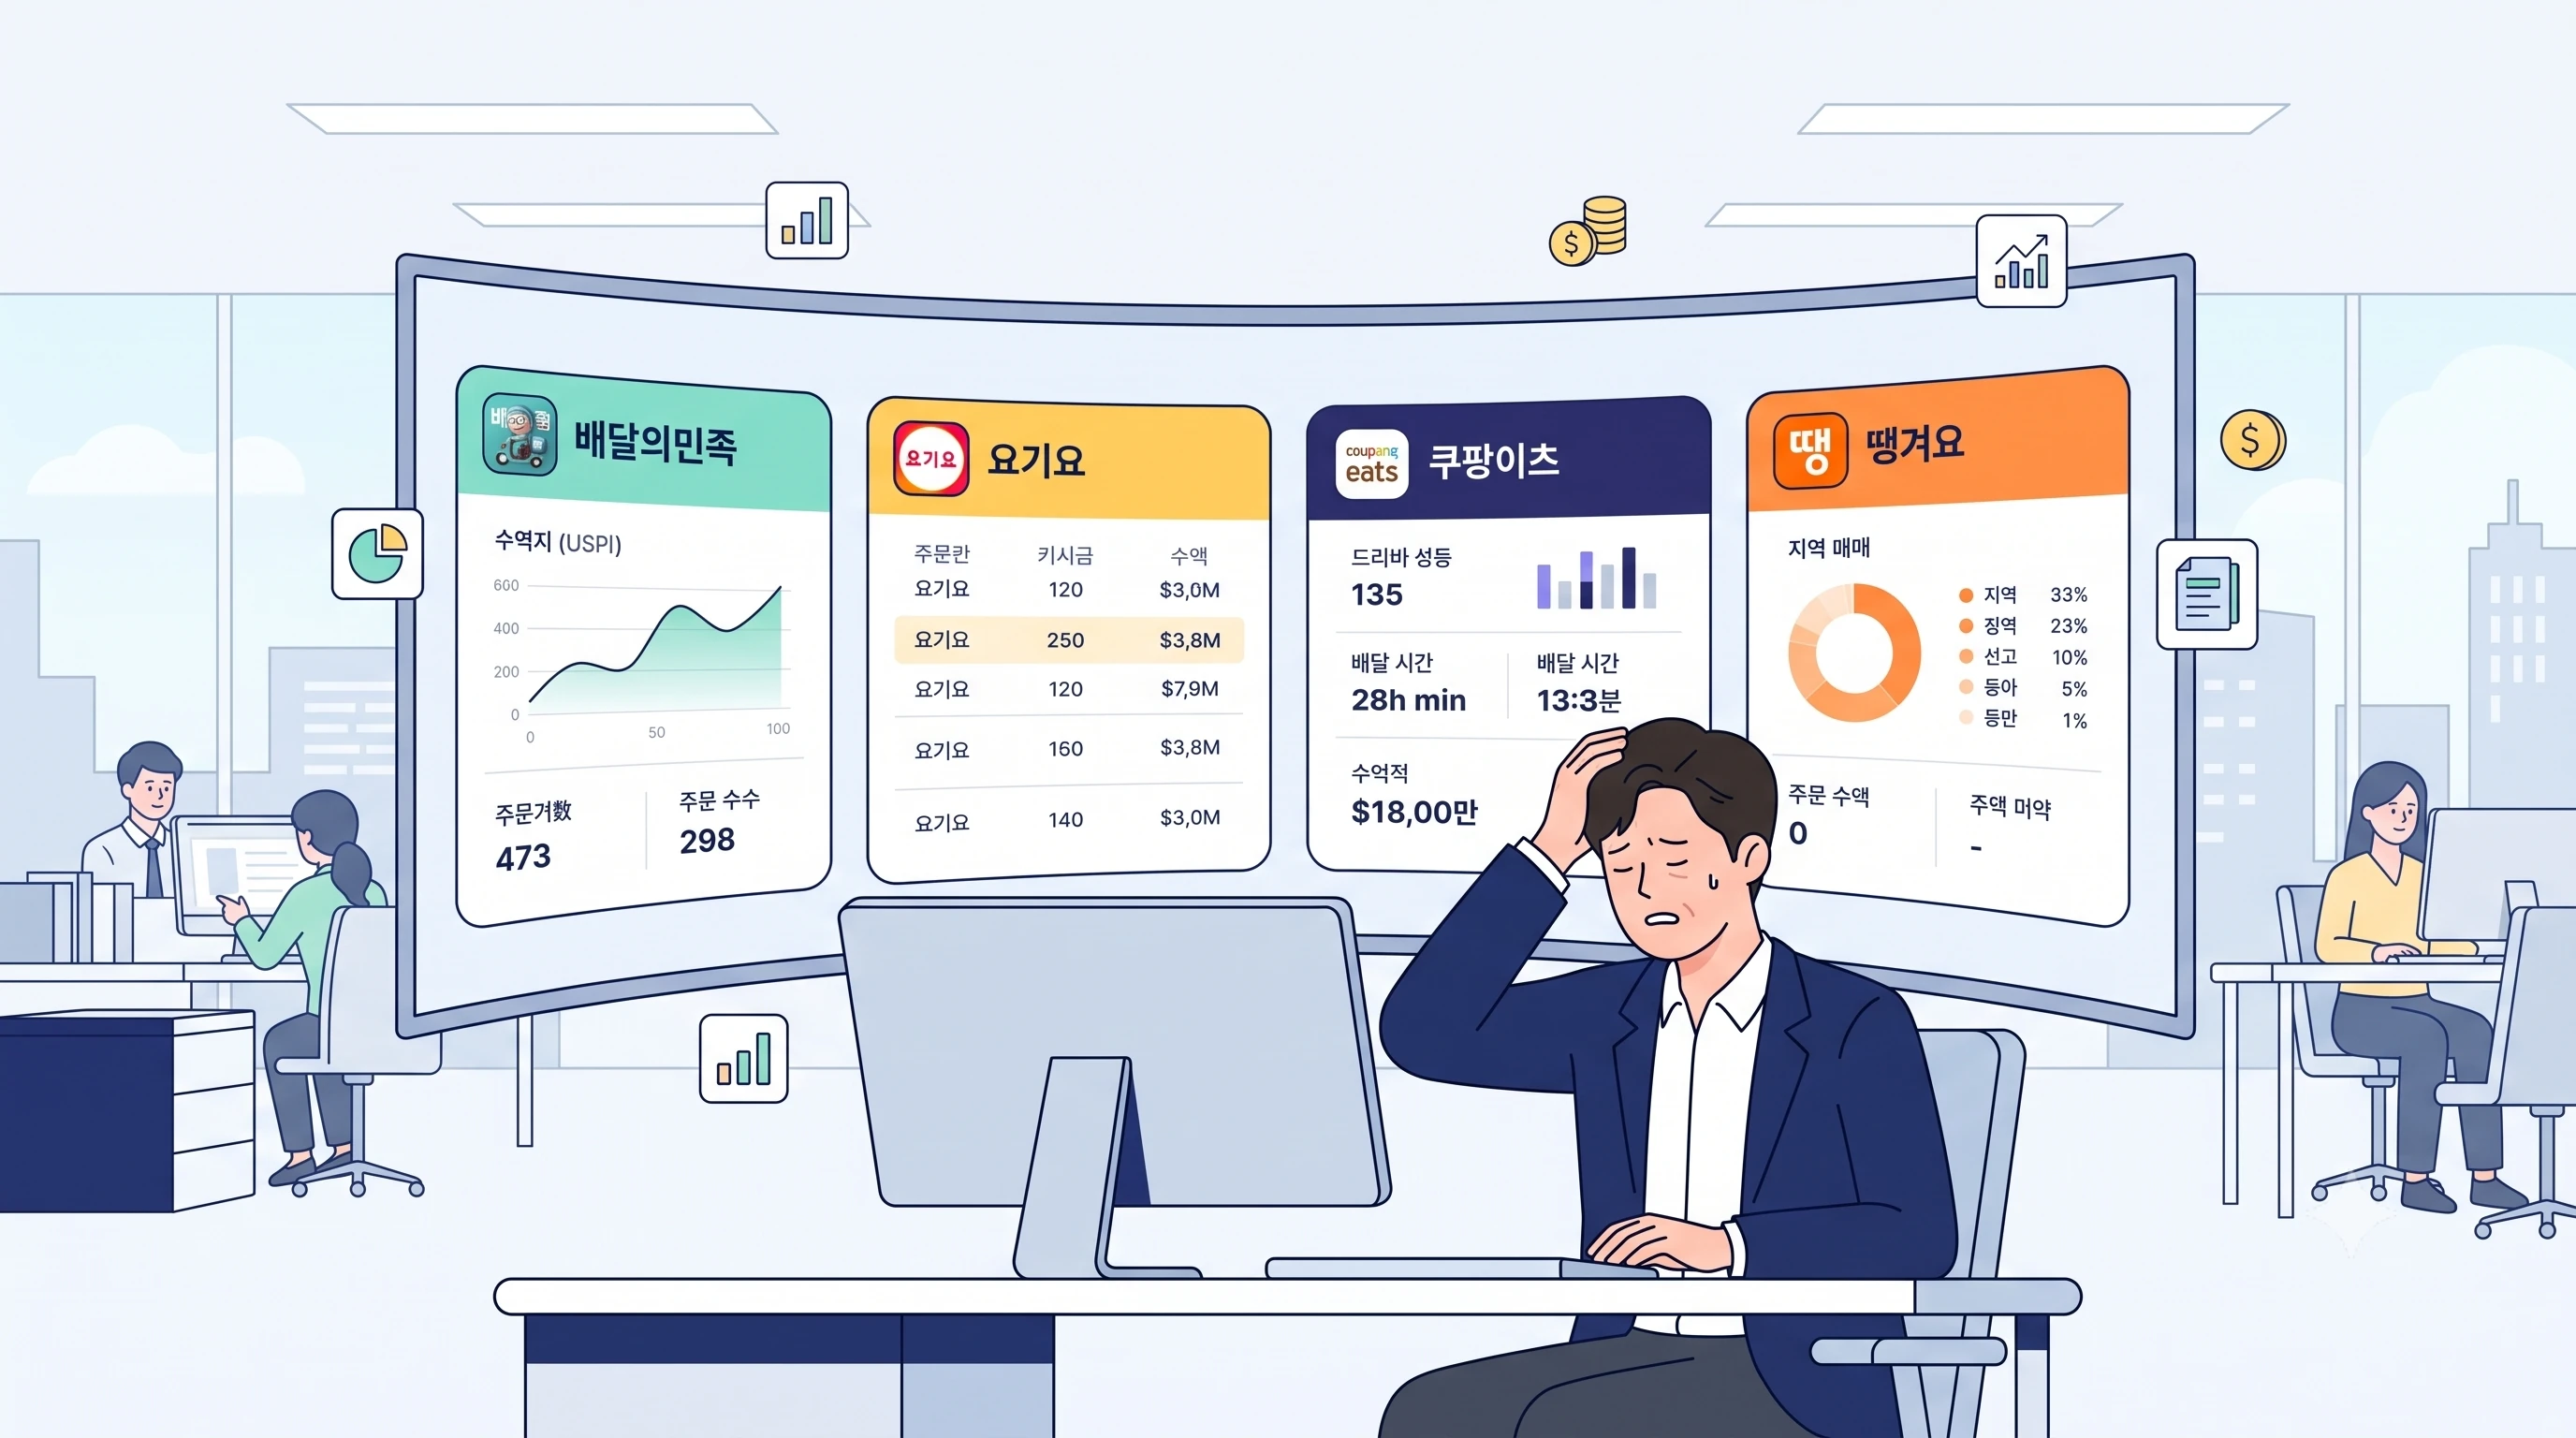
Franchisor staff reviewing scattered delivery‑app sales data across multiple admin screens
CORE SUMMARY
Delivery sales are now a core metric that franchisor headquarters must control. As the share of delivery‑app revenue in store sales grows, headquarters need to monitor Baemin, Coupang Eats, Yogiyo and other platforms together. As of March 2025, about 27.01 million Korean smartphone users were using delivery apps, and reports in March 2026 indicated that the combined payment volume of the four major platforms exceeded ₩3 trillion. The delivery channel is no longer a store‑level concern—it drives brand‑wide operations and must be tracked at the headquarters level.
Data sources: WiseApp·Retail March 2025 delivery‑app trends, March 2026 delivery‑app payment report, Fair Trade Commission announcement on delivery‑app terms, Google AI Search Optimization Guide
In a nutshell
Franchise headquarters must go beyond checking delivery‑app sales by platform and consolidate data by franchise location, period, and platform into a headquarters‑level view.
POINT 01
Platform‑by‑platform checks have limits.
Looking at Baemin, Coupang Eats, and Yogiyo separately makes it hard to grasp the brand’s overall trend quickly.
POINT 02
Headquarters need to see the full picture.
You need to view each franchise location’s ranking, period‑over‑period changes, and platform share together to make operational decisions.
POINT 03
Move beyond manual Excel aggregation.
Staff should spend time analyzing data, not gathering it.
Why has integrated delivery‑app sales reporting become a headquarters priority?
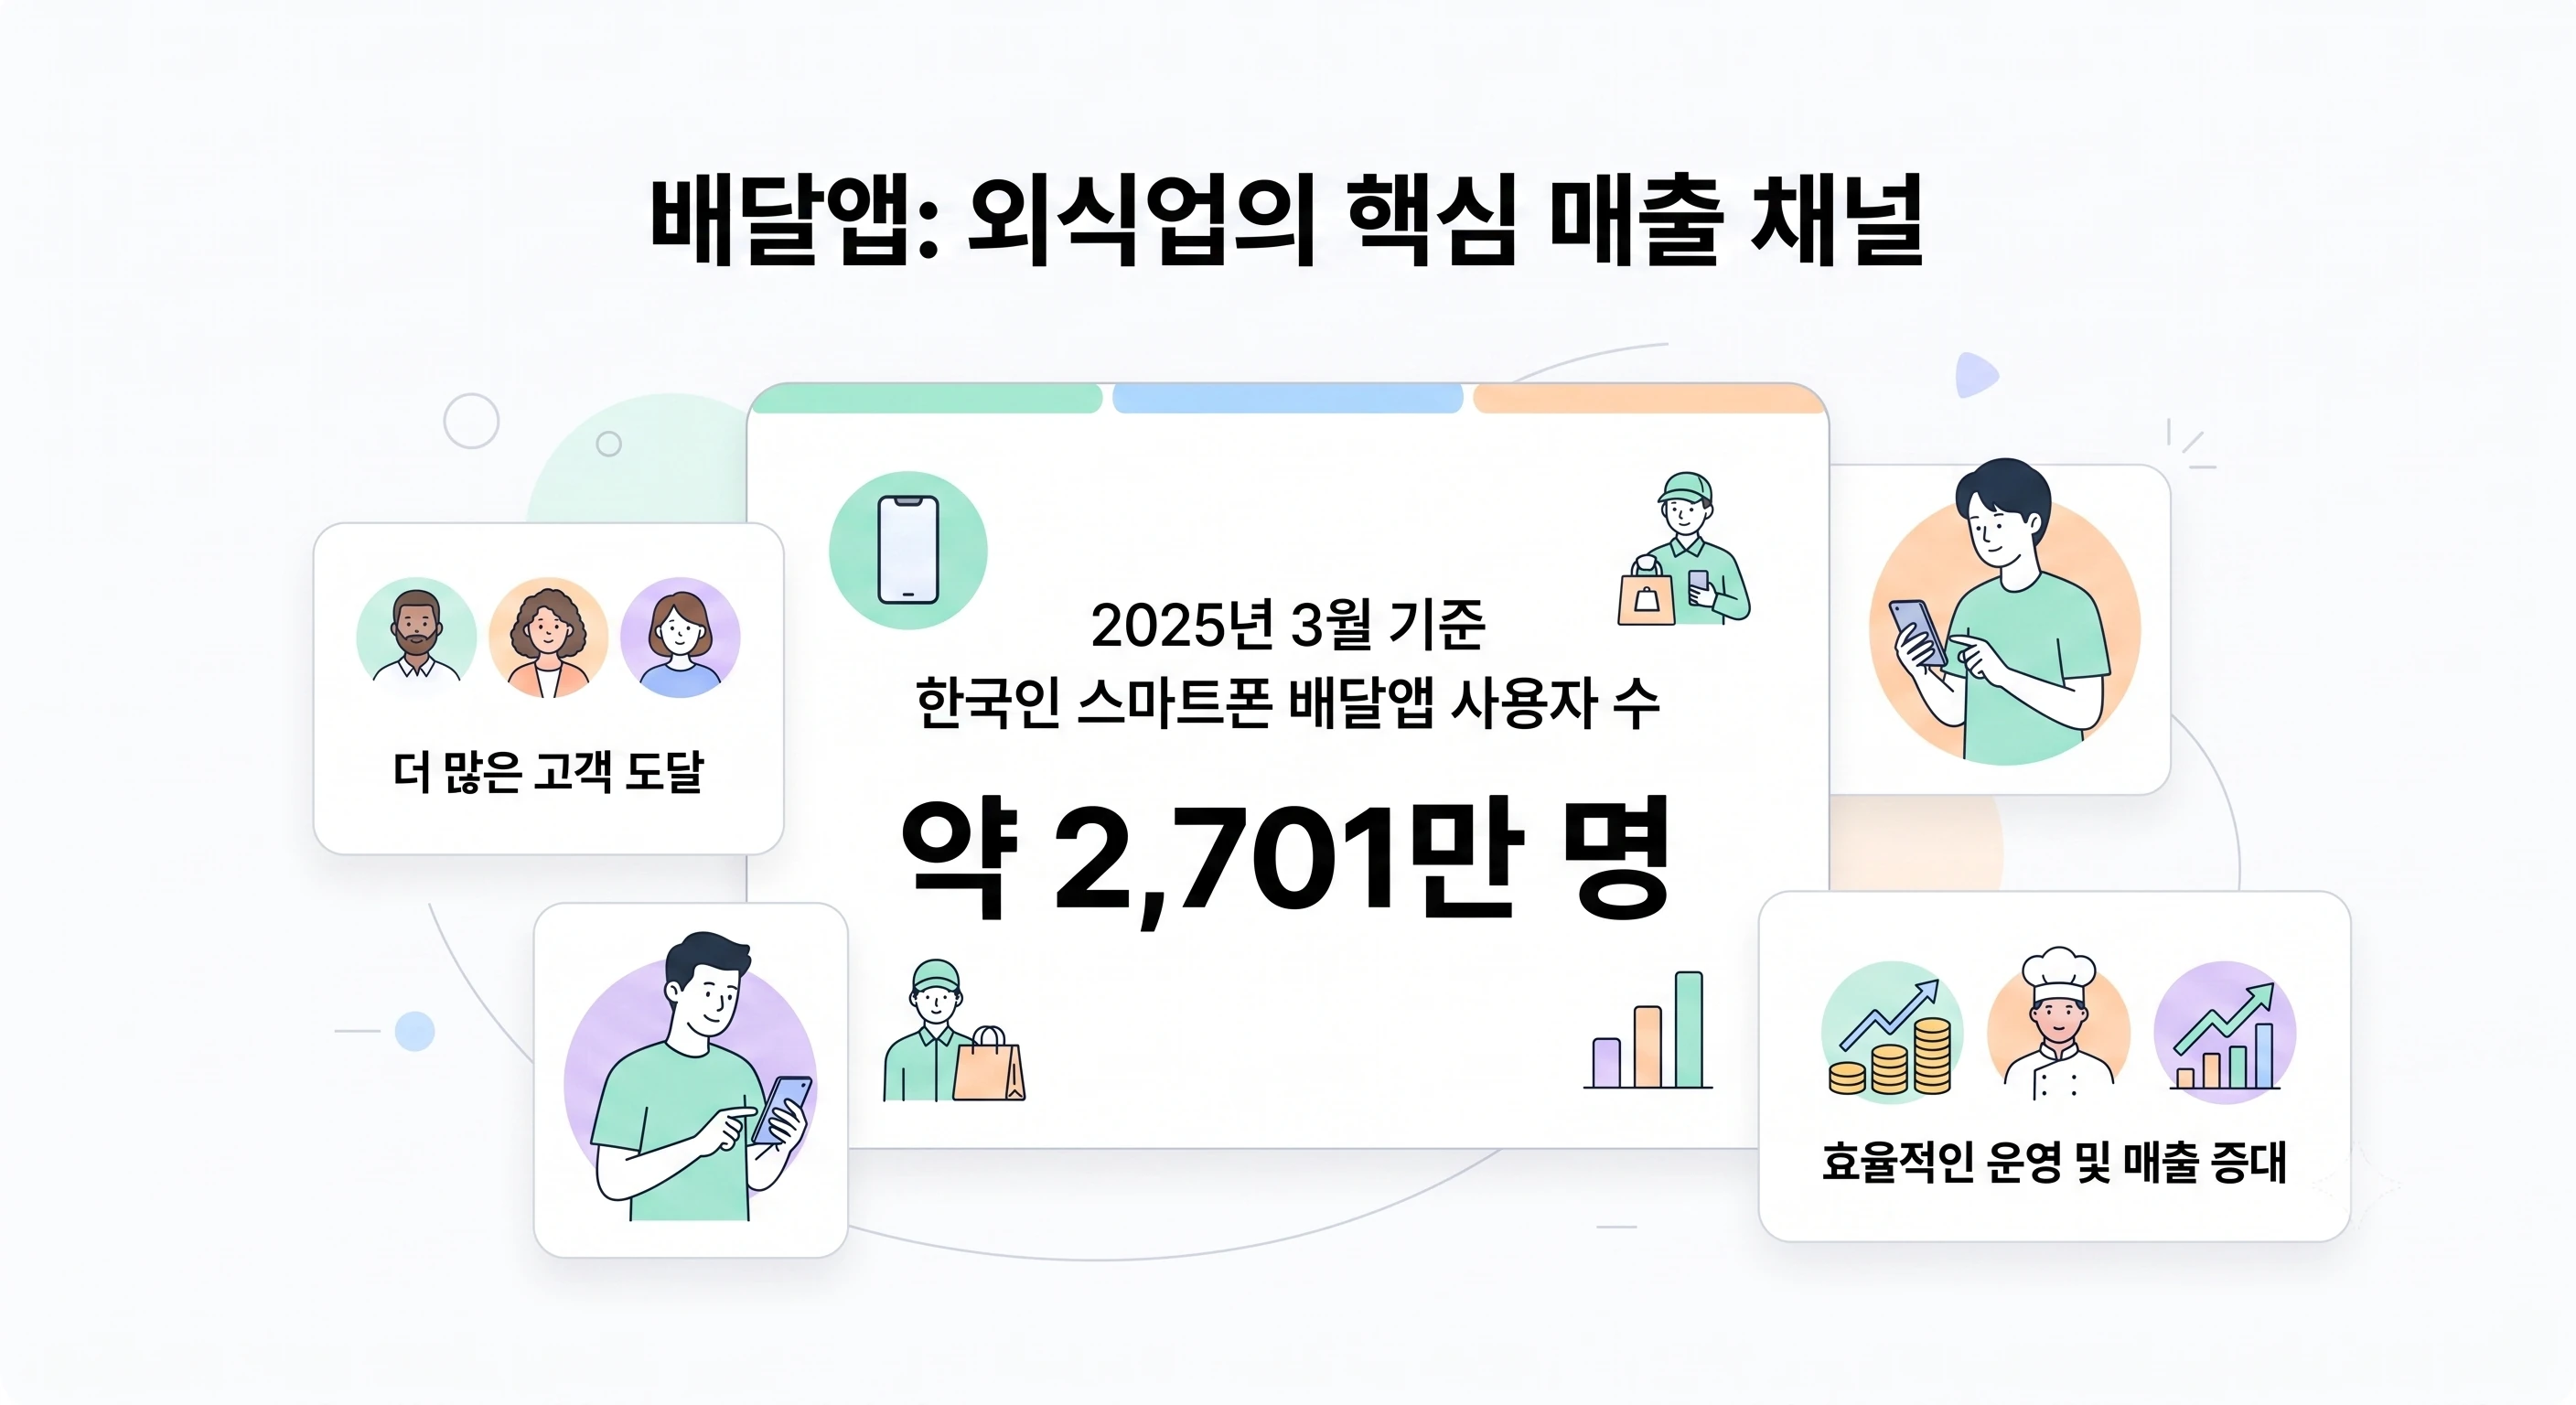
Delivery sales are no longer a side channel for restaurant franchises. Cafés, chicken, pizza, snack, burger, Korean, salad, and dessert brands all reach customers via delivery apps. Some locations generate more revenue from delivery than dine‑in, and in new markets the app listing often serves as the first customer touchpoint.
The problem is that as delivery sales grow, headquarters management becomes more complex. Checking each platform’s admin page separately, consolidating franchise location sales in Excel, and then reformatting the data for headquarters reports consumes more time than expected. When you have 10 stores, manual work is manageable, but at 50 or 100 locations the situation changes dramatically.
In practice, these questions come up often: “Which store saw the biggest delivery‑sales increase this month?” “How have platform shares shifted?” “Which stores saw delivery sales drop compared to last month?” “Can we see the overall delivery‑sales trend at a glance from the headquarters perspective?” If you can’t answer quickly, it’s time to stop viewing delivery sales by platform.
AEO ANSWER BLOCK
Reasons franchise headquarters need integrated delivery‑app sales reportingWhen data is scattered across Baemin, Coupang Eats, Yogiyo, etc., it’s hard to quickly assess franchise‑location sales trends, period changes, platform dependence, and promotion impact. Headquarters must consolidate delivery sales by franchise location to see the brand’s overall flow.
1. Delivery sales have risen, but headquarters management has become more complex
Delivery apps are a critical revenue channel for the restaurant industry. Customers search for stores, compare menus, order, pay, and review—all within the app. For headquarters, the app is not just an order channel but also a brand‑exposure, promotion, and new‑customer acquisition channel.
However, from the franchisor headquarters' management perspective, the story changes. Managing delivery sales for 10 franchise locations versus 100 franchise locations is entirely different. As the number of locations grows, you must monitor platform‑by‑platform revenue, revenue per franchise location, period‑over‑period changes, regional differences, pre‑ and post‑promotion shifts, and platform dependence.
For example, if a brand operates 80 franchise locations and each uses three delivery apps, the franchisor headquarters must track up to 240 delivery‑revenue streams. Adding daily, weekly, and monthly comparisons, month‑over‑month changes, location rankings, and regional variations quickly exceeds what can be handled with Excel aggregation alone.
| Management overview | Individual platform verification | Headquarters unified view |
|---|---|---|
| Revenue review | Platform‑specific admin access | Consolidated view by franchise location |
| Period comparison | Manual processing after file download | Track daily, weekly, and monthly trends |
| Location comparison | Standardize by location name and period | View rankings and growth rates per location |
| Headquarters decision | Post‑aggregation decision | Rapid response via dashboard |
2. The franchisor headquarters must focus on the overall trend rather than individual revenues.
HEADQUARTERS DASHBOARD
Total delivery revenue
1.28 billion
vs. last month
+8.4%
Growing stores
42 locations
Declining stores
11 locations
Store
Delivery sales
Change rate
Key platforms
Gangnam location
48.2 million
+14%
Baemin
Songdo location
31.4 million
-7%
Coupang Eats
The headquarters dashboard provides a single view of total brand delivery sales, store rankings, and trend data by period.
Franchisees look at their own store’s delivery sales. However, the franchisor headquarters must view the brand’s overall performance. Beyond noting that a particular store’s delivery sales have risen, you need to determine why, whether the insight applies to other locations, if it’s driven by a specific platform, or by regional demand shifts.
The questions the headquarters must answer differ from those of individual franchisees: Which locations have seen a sharp drop in delivery sales? Where are delivery sales increasing? Which stores rely heavily on a particular platform? Are there stores where delivery sales grew but total sales fell? And is the post‑promotion delivery sales lift sustainable?
Answering these questions requires the headquarters to aggregate delivery‑app data in a decision‑ready format. It’s not enough to look at raw platform numbers; the data must be organized so that the operations team, supervisors, marketing, and executives can all review the same metrics and keep store‑management strategies aligned.
Key delivery‑sales questions for the headquarters
· Which locations experienced a steep decline in delivery sales compared to the previous month?
· Which locations have an excessive concentration of sales on a single platform?
· Are there stores where delivery sales rose but overall sales fell?
· Is the sales increase after a promotion being maintained?
Three scenarios when integrated delivery‑sales reporting is essential
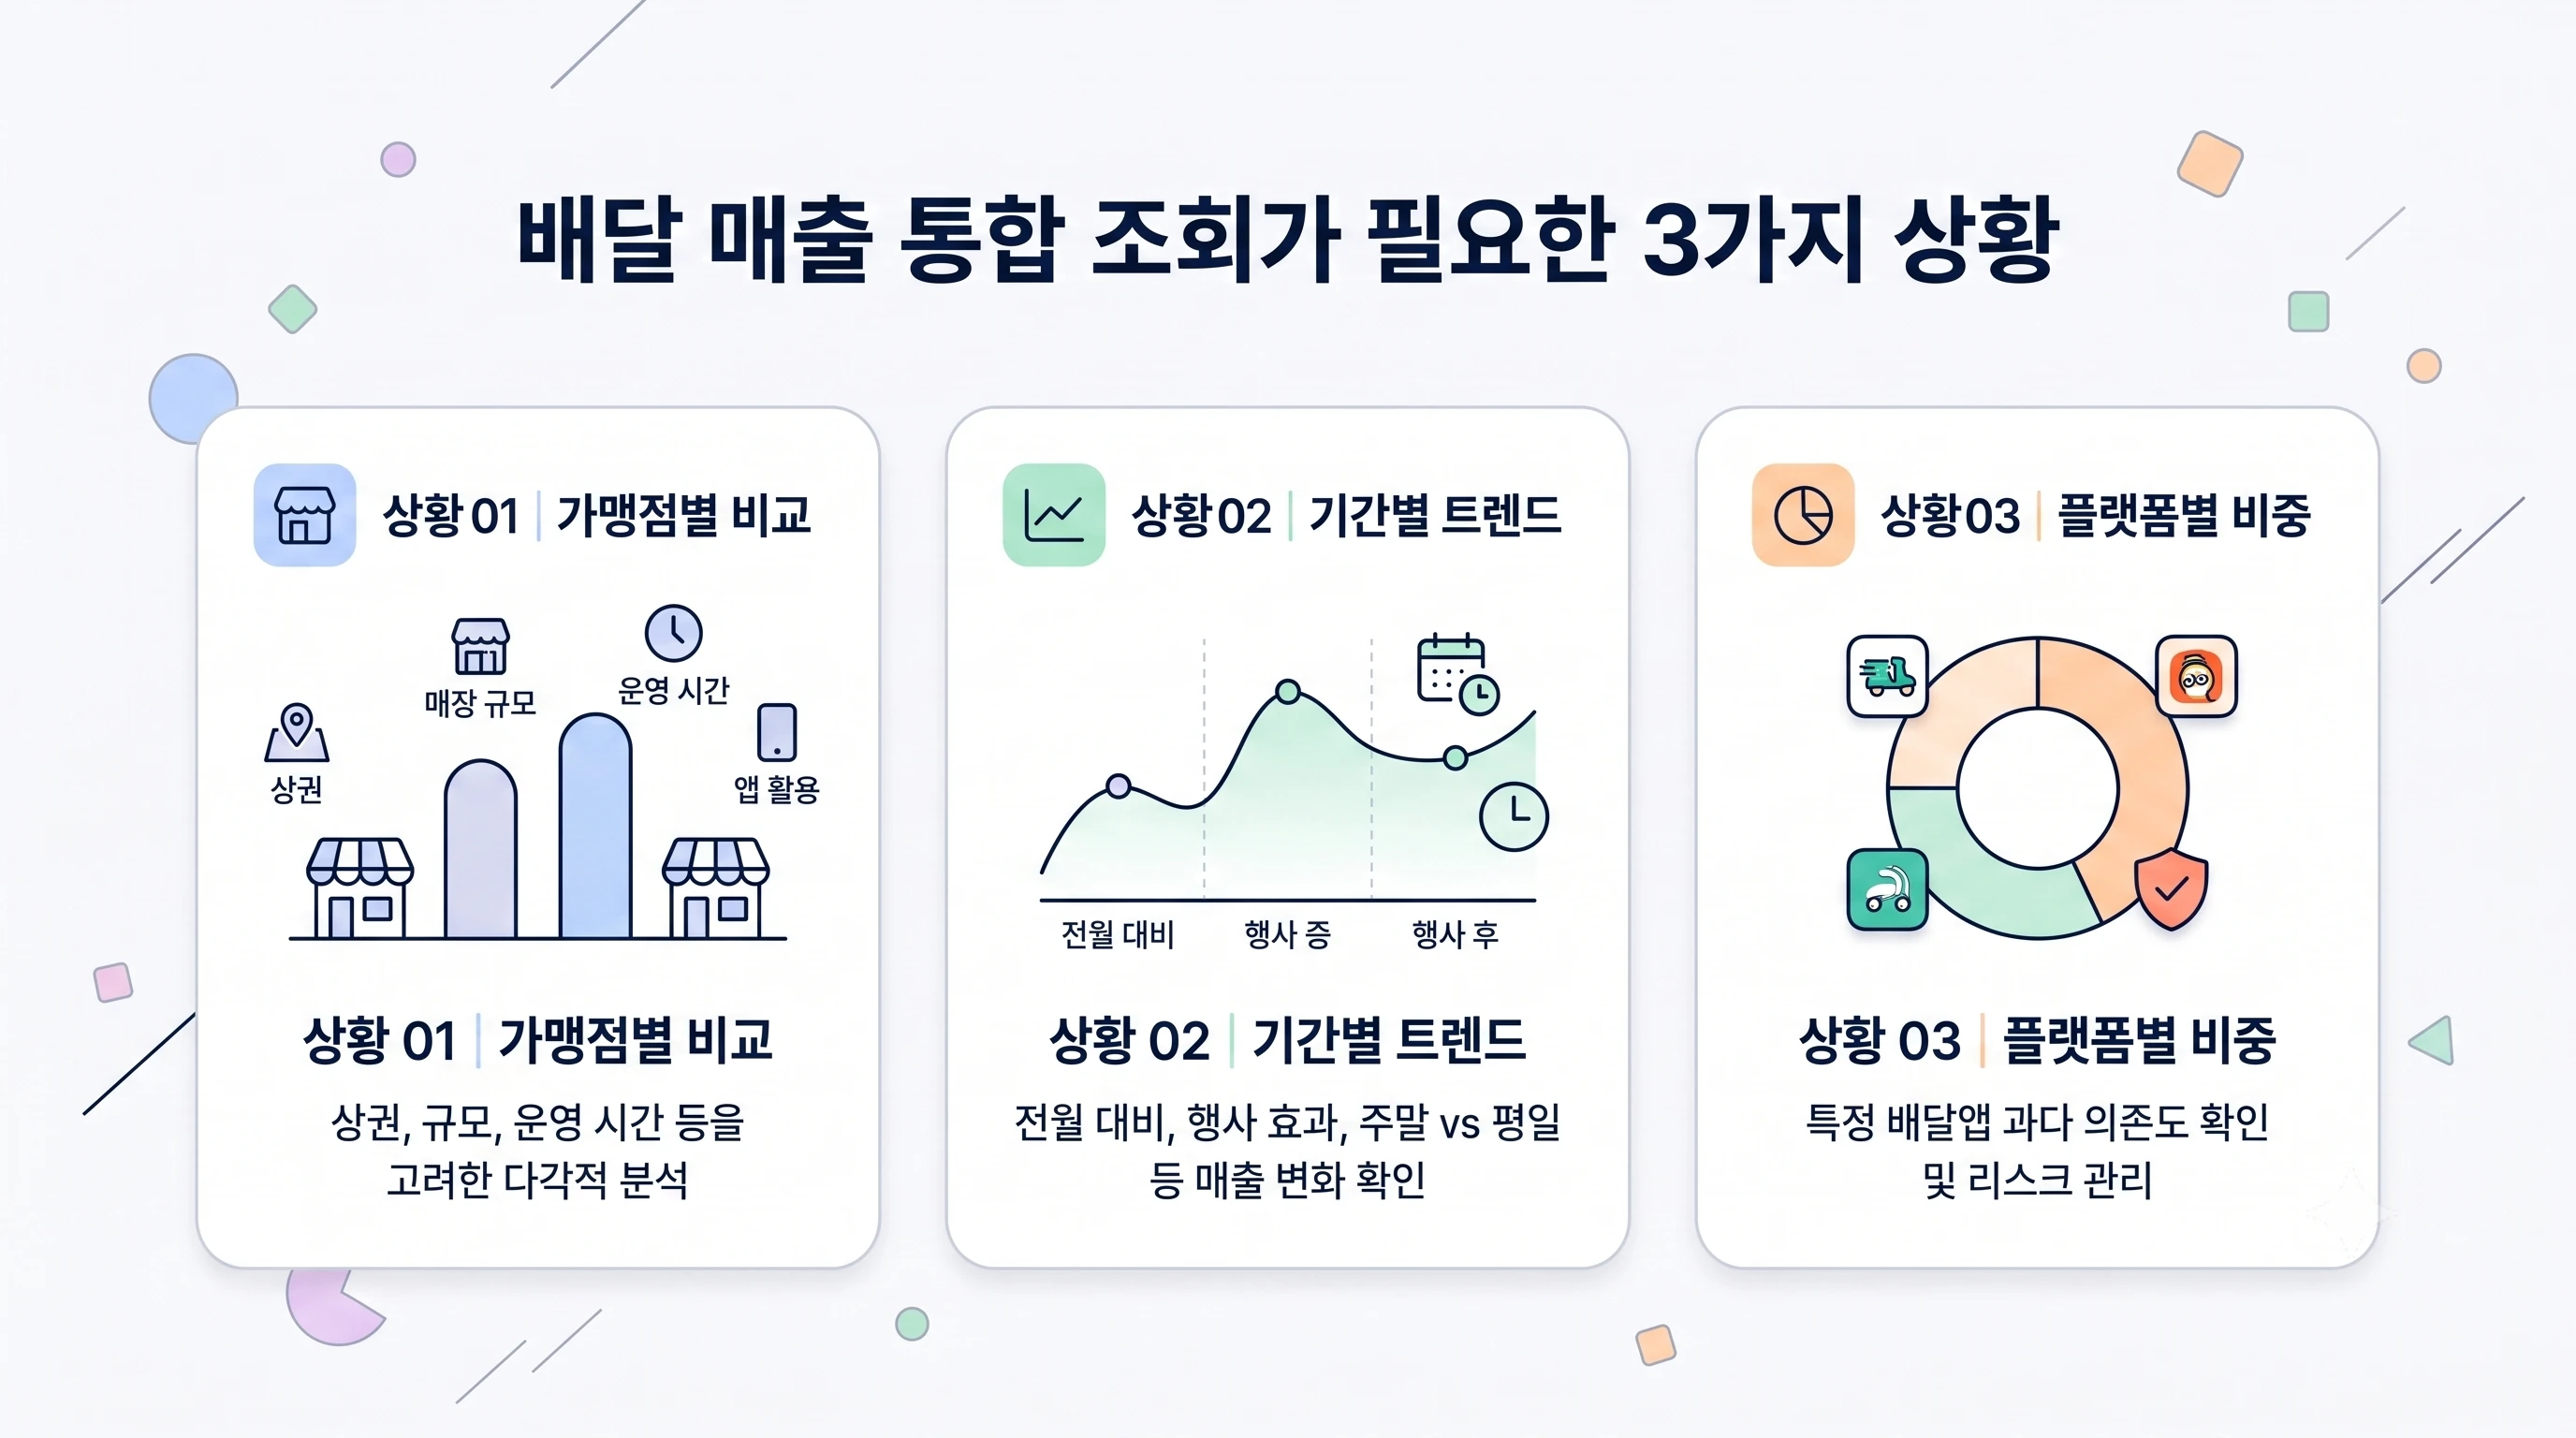
Infographic cards showing the three situations that require integrated delivery‑sales reporting
First, when comparing delivery sales across franchise locations
Don’t rely solely on a simple ranking of high‑ versus low‑performing stores. You must also consider market area, store size, operating hours, delivery‑app usage, advertising spend, and review‑management quality. Still, the starting point is consolidated sales data. The headquarters needs a uniform basis to compare all locations and decide which stores require support.
Second, when tracking sales trends over time
Check whether delivery sales have dropped month‑over‑month, whether sales after a specific event remain stable, and whether weekend‑weekday differences are significant. This data is essential for evaluating marketing effectiveness. A sales spike during an event doesn’t automatically mean success; you must verify post‑event retention and whether new customers are re‑ordering.
Third, when assessing platform dependency
If a store’s delivery sales are overly concentrated on one app, it becomes more vulnerable to exposure policies, fee changes, or rising ad costs. The headquarters should monitor each location’s platform mix to manage risk. Even with identical total delivery sales, a store with 80% Baemin versus one split 50% Coupang Eats, 30% Yogiyo, 20% Baemin faces a very different risk profile.
| Purpose of the query | Data to be reviewed | How the headquarters can use it |
|---|---|---|
| Franchise location comparison | Delivery sales, rankings, and growth rates by franchise location | Identify underperforming versus growing franchise locations |
| Period Analysis | Daily, weekly, and monthly sales trends | Assess seasonal performance and campaign impact |
| Platform Share | Delivery sales share of Baemin, Coupang Eats, and Yogiyo | Evaluate platform dependence and advertising strategy |
| Promotion Analysis | Pre‑ and post‑event sales, retention, and franchise location response | Determine the effectiveness of marketing spend |
4. Delivery sales are an operational metric, not just revenue
Delivery sales are not just raw revenue data. They reflect store operational health, marketing effectiveness, platform reliance, and regional demand. If a franchise location’s delivery sales drop suddenly, it may not be merely fewer orders—it could be lower review scores, reduced delivery windows, paused advertising, or new competitors entering the market.
Conversely, a sudden surge in delivery sales isn’t always positive. It might result from aggressive discount coupons that boost volume but lower average order value, hurting profitability. Therefore, the integrated delivery sales view should serve as a diagnostic starting point, not just a display of numbers.
Headquarters should evaluate delivery sales alongside dine‑in sales, total sales, cost of goods, promotional spend, royalties, receivables, and supervisor visit logs. If delivery sales rise while total sales stagnate, dine‑in customers may be shifting to delivery. If delivery sales increase and receivables grow, the settlement structure and franchisee profitability need review.
Delivery sales risks that headquarters often overlook
• Delivery sales increase while dine‑in sales decline, causing overall sales to plateau
• Heavy reliance on a single platform makes the franchise vulnerable to fee or exposure policy changes
• Sales spike during promotions but fail to sustain after the event ends
· Even when delivery sales rise, settlement amounts, royalty collections, and franchisee profitability may not improve
5. FDAM enables the franchisor headquarters to view delivery sales in a unified dashboard
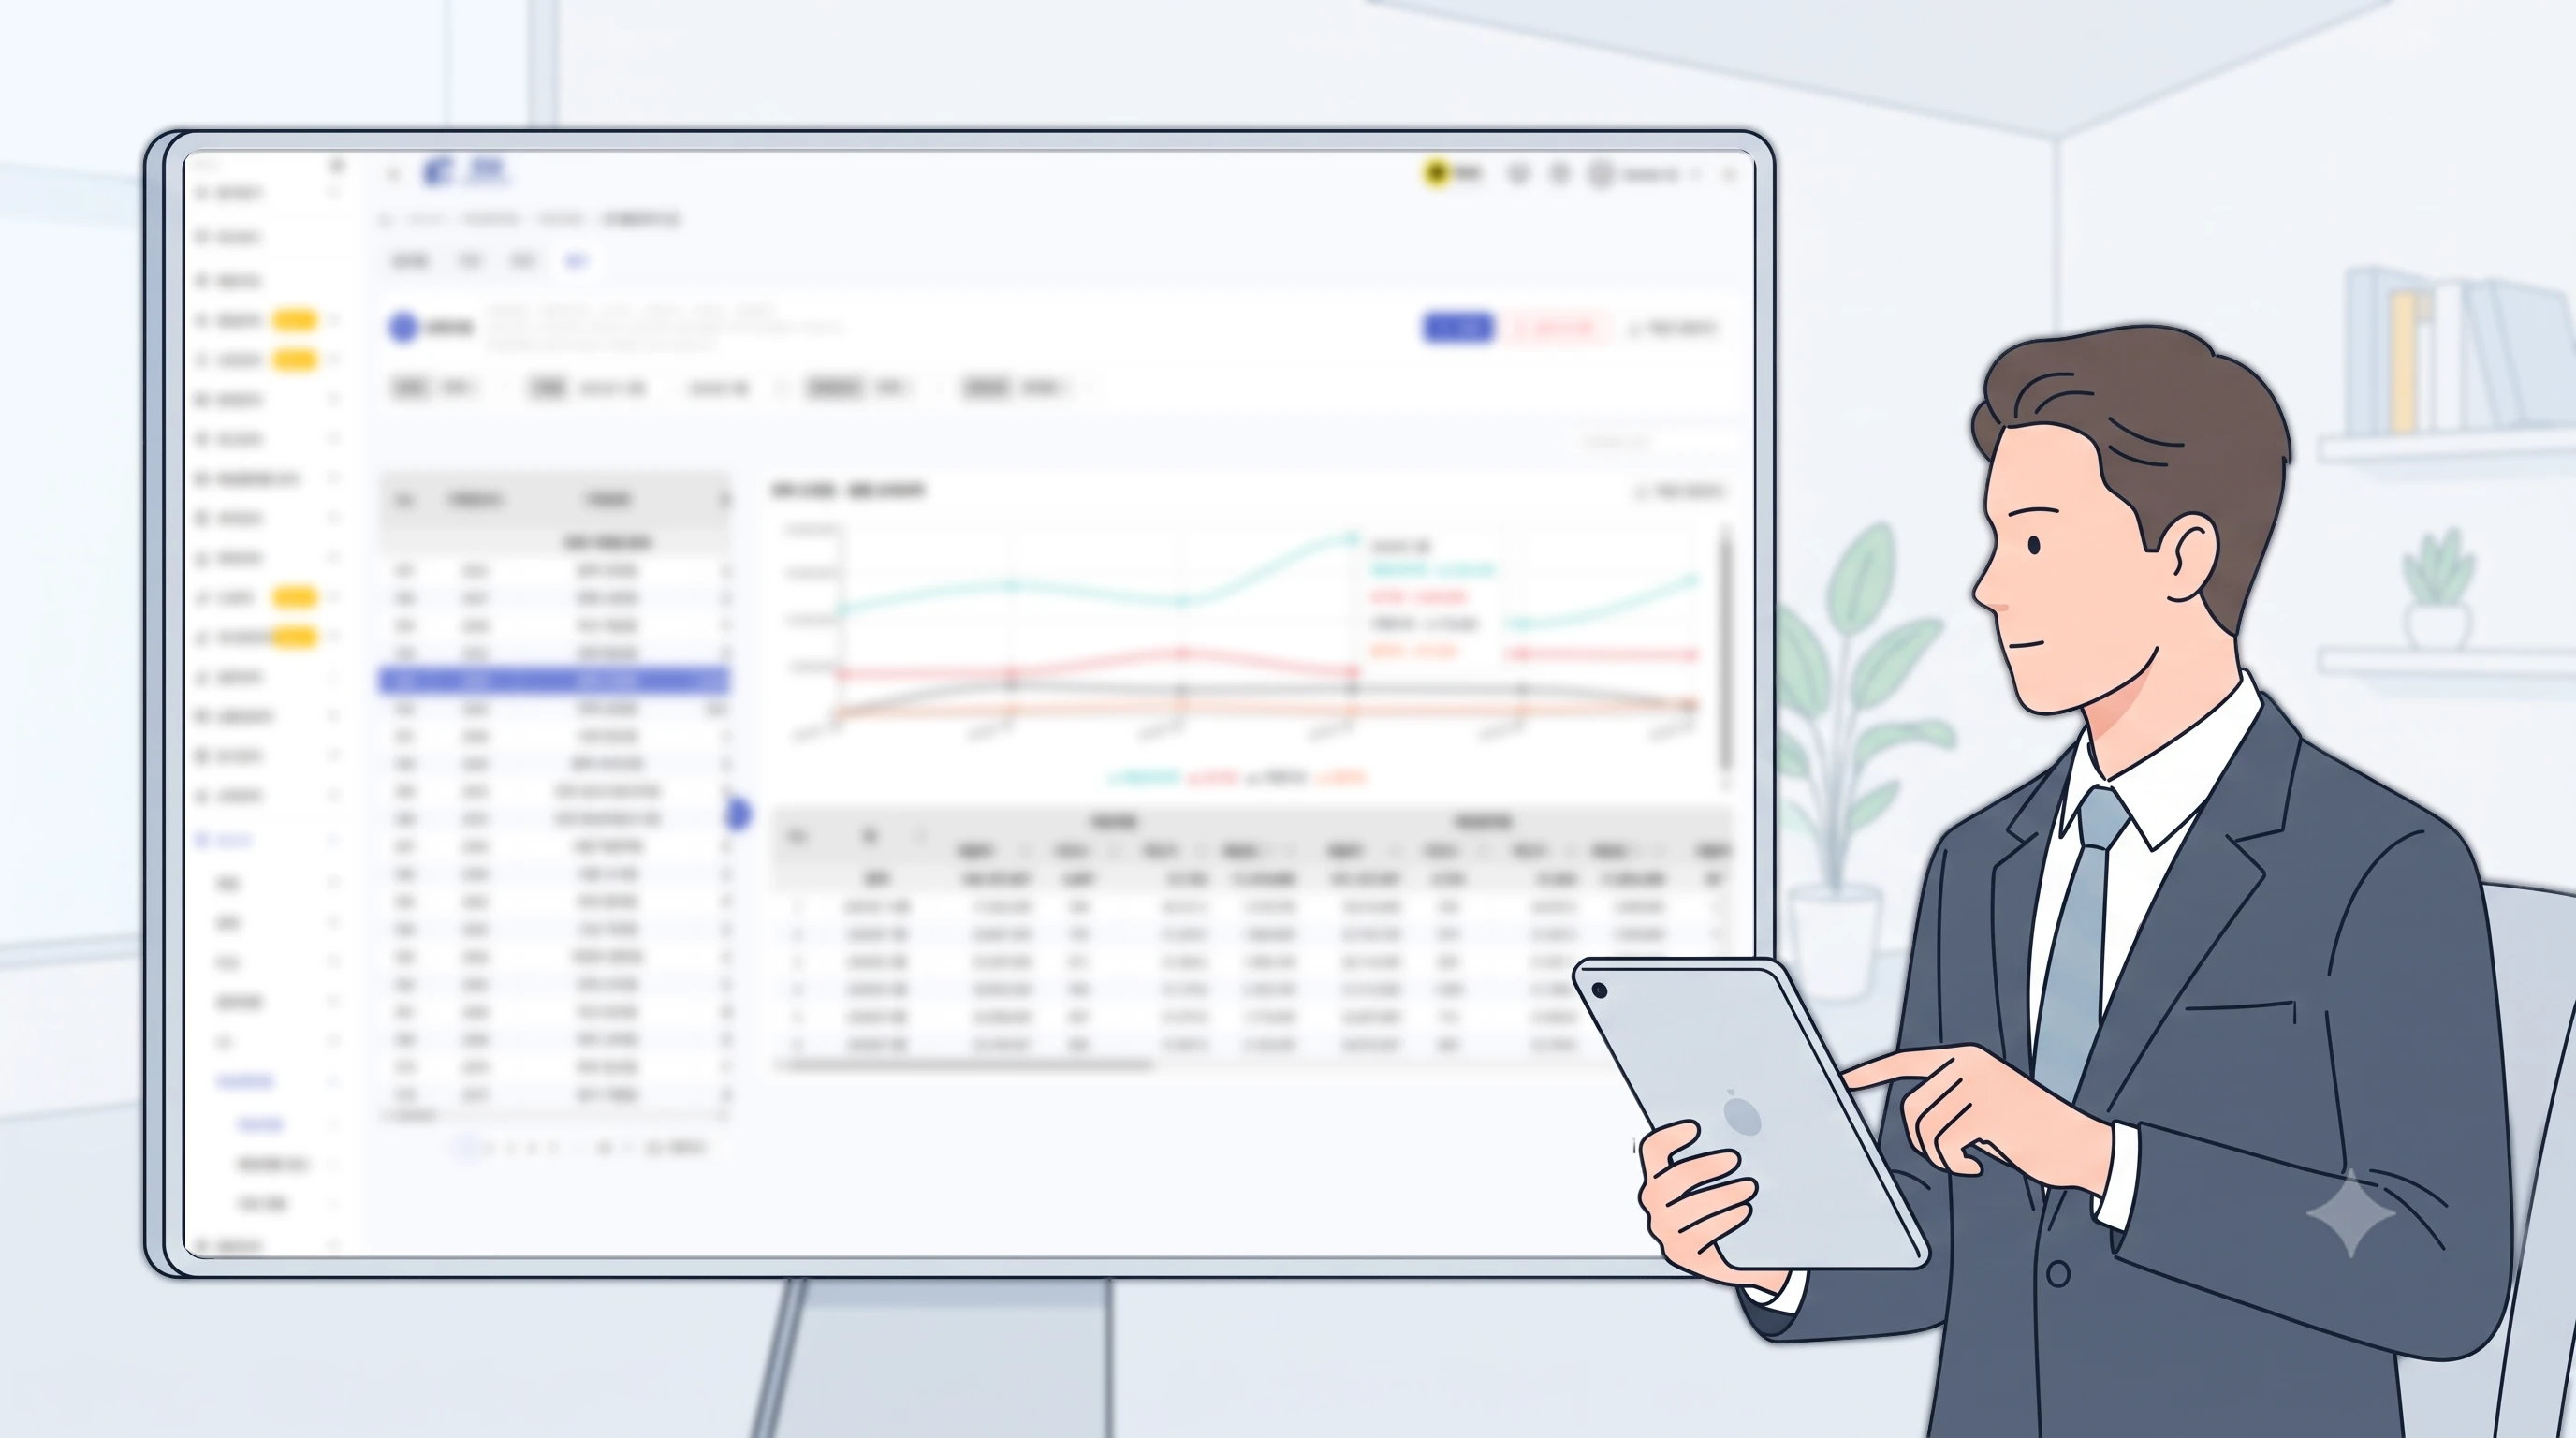
Dashboard on FDAM that consolidates sales by delivery app and by franchise location
FDAM is an ERP solution that lets franchisor headquarters manage all franchise location operations data in one place. By using FDAM’s unified delivery sales view, headquarters can move beyond checking each delivery app separately and monitor sales flow from a central perspective.
Seeing each franchise location’s delivery sales, trends over time, and platform share together lets you assess store performance faster. For example, if a specific store’s delivery sales drop compared to the prior month, headquarters can investigate the cause rather than just noting a decline—determining whether the drop is limited to a single platform, affects overall delivery sales, or differs from offline sales.
Marketing teams can verify whether delivery‑app promotions actually moved the needle, and supervisors can identify counseling points based on each store’s delivery sales trends. In short, the unified delivery sales view is not merely a reporting tool—it becomes an operational benchmark that supports store management and marketing decisions at headquarters.
| Headquarters challenges | FDAM’s management approach |
|---|---|
| Checking each delivery‑app admin page separately | Consolidating Baemin, Coupang Eats, and Yogiyo sales at the headquarters level |
| Difficult to rank franchise locations by delivery sales | View sales, growth rate, and platform share for each store on a single screen |
| Hard to assess promotion effectiveness accurately | Compare delivery sales changes before and after events over time |
| Challenging to identify dependence on specific platforms | Compare platform sales share by franchise location to spot risk |
| Excel aggregation takes too long | Reduce repetitive aggregation and focus on analysis and response |
6. Moving away from Excel aggregation speeds up headquarters operations
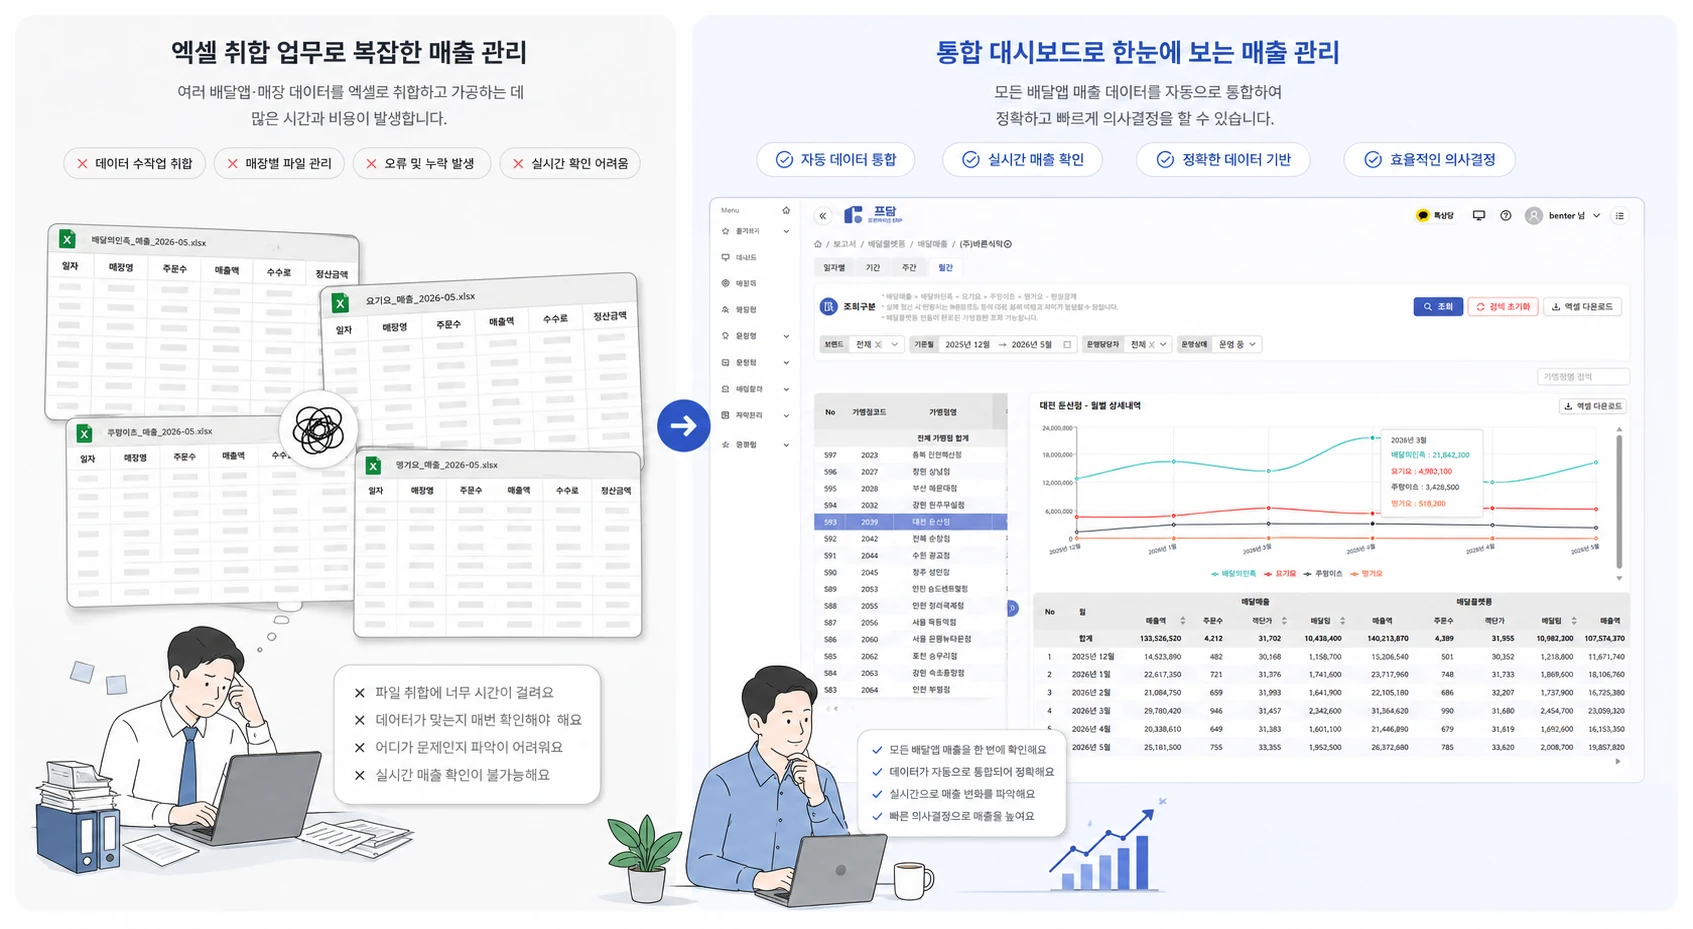
Side‑by‑side view of a cluttered Excel aggregation screen versus a streamlined integrated dashboard
Managing delivery sales solely in Excel overloads staff. Downloading files from each platform, matching store names, standardizing periods, and rebuilding reports creates error risk. At franchisor headquarters, a single staff member often oversees many locations. When data consolidation takes too long, critical analysis and response are delayed.
The headquarters should focus on interpreting data, not gathering it. Quickly identify which stores need support, which platform’s sales share has shifted, and where delivery demand is rising. Spending a day on Excel consolidation pushes analysis and action to the back burner.
FDAM organizes delivery sales data from an operations perspective, letting staff shift focus from repetitive aggregation to store management and decision‑making. The speed of headquarters operations ultimately depends on how fast the data is compiled.
Common issues in Excel aggregation
· Store names differ by platform, making it hard to match the same location
· Varying reporting periods cause inconsistent month‑over‑month change calculations
· Each time a reporting file is created, formula errors or omissions can occur
· When staff change, aggregation methods and judgment criteria also change
7. Supervisors and the marketing team must view the same data
Integrated delivery sales view isn’t just for the operations team. When supervisors, marketing, and executives see the same data, decision‑making at headquarters becomes faster and more accurate. Supervisors can track a store’s delivery sales trend to pinpoint coaching points, marketing can compare promotion performance across stores, and executives can assess overall brand delivery channel growth and risks.
For example, suppose the marketing team runs a discount promotion on a specific platform. Reporting only that total sales rose during the promotion isn’t enough. You need to know which stores responded most, which regions saw the biggest impact, whether sales held after the promotion ended, and whether sales on other platforms declined.
Supervisors also rely on integrated data. When a franchisee says, “Delivery volume has dropped lately,” you must determine whether it’s a perception or an actual decline. If the drop is isolated to one platform, investigate exposure, reviews, advertising, or operating hours. If overall delivery sales are down, examine market demand and competitor activity.
| User | Use cases for integrated delivery sales view |
|---|---|
| Operations team | Monitor brand‑wide delivery sales trends and spot underperforming stores |
| Supervisor | Diagnose delivery sales drops for each store and determine coaching points |
| Marketing Team | Analysis of sales changes and store-level responses before and after delivery app promotions |
| Executive Team | Assess delivery channel growth, platform risks, and brand operating direction |
8. Delivery App Sales Consolidated Review Checklist
This checklist serves as a benchmark for franchisor headquarters to evaluate how systematically delivery sales are being managed. It’s not just about accessing the delivery app admin page; the key is whether the headquarters can compare data by franchise location, period, and platform.
| Category | Checklist Question | Data to Verify |
|---|---|---|
| 01 | Can sales from Baemin, Coupang Eats, and Yogiyo be compared on a single screen? | Sales by platform |
| 02 | Can you view delivery sales rankings and growth rates by franchise location? | Store sales compared to the previous month |
| 03 | Can delivery sales trends be viewed by day, week, and month? | Trend charts by period |
| 04 | Can platform dependency be assessed for each franchise location? | Revenue share by delivery app |
| 05 | Can we compare delivery revenue changes before and after promotions? | Revenue before and after the event |
| 06 | Can we quickly identify franchise locations with declining delivery revenue? | Decline rate and list of outlier locations |
| 07 | Are operations, supervisors, and marketing teams viewing the same data? | Franchisor headquarters shared dashboard |
9. 30‑day action plan to launch integrated delivery revenue management
Integrated delivery revenue management doesn’t require perfect metrics from the start. The key is to start with the core questions the franchisor headquarters must review repeatedly. Begin by aggregating platform revenue at the franchise location level, standardizing time‑period comparisons, and then looking at each location’s ranking and change rate.
Week 1: Identify data sources for each platform
Document where to access Baemin, Coupang Eats, and Yogiyo revenue data and in what format to download it.
Week 2: Standardize by franchise location
Unify store names, store codes, regions, and assigned supervisor identifiers that vary across platforms.
Week 3: Define key metrics
We focus on total delivery sales, month‑over‑month change rate, platform share, underperforming stores, and pre‑/post‑promotion sales as key metrics.
Week 4: Apply dashboard‑based operations meetings.
The operations team, supervisors, and marketing team review the same dashboard to spot underperforming stores, growth stores, and platform risks.
Delivery sales management is no longer just a single franchise location’s responsibility.
Delivery sales are rising, but if headquarters still rely on checking each platform separately and aggregating data in Excel, operational speed will inevitably lag. While HQ verifies app sales, the market moves faster—platform policies change, demand shifts, and new competitors appear.
Headquarters must move beyond separate app checks and consolidate delivery sales across the entire franchise network. You need a single view of each franchise location’s sales flow, period‑over‑period changes, and platform mix so operations, supervisors, and marketing can act in sync.
Delivery sales management is a core KPI for the franchisor headquarters, not just an individual store task. Beyond identifying top‑performing locations, HQ must explain why they succeed, where declines occur, and what platform risks exist.
Frequently Asked Questions
Q. Why do we need integrated delivery sales visibility?
A. Looking at each delivery app in isolation makes it hard to see the brand’s overall trend. Headquarters must view sales by franchise location, period, and platform together for accurate management. As the number of franchise locations grows, relying on platform admin pages and Excel aggregation slows operations.
Q. Why is comparing delivery sales by franchise location important?
A. Store‑level delivery sales differences reveal market dynamics, operating hours, promotion impact, and platform dependence. This data supports supervisor consultations and marketing strategy development. It’s essential to look at month‑over‑month change rates and platform shares, not just raw sales rankings.
Q. Why track platform dependence?
A. When sales are overly concentrated on a single delivery app, the store becomes vulnerable to changes in exposure policies, fee structures, or ad costs. Headquarters should monitor each store’s platform mix to spread risk and adjust platform‑specific marketing tactics.
Q. How should we evaluate delivery app promotion effectiveness?
A. Don’t rely solely on sales during the promotion period. Assess pre‑ and post‑promotion sales shifts, post‑promotion retention, store‑level response differences, and any drop in sales on other platforms. Integrated delivery sales visibility lets headquarters analyze promotion impact faster.
Q. How does FDAM help with delivery sales management?
A. FDAM lets headquarters view delivery sales data in one place, track each franchise location’s sales flow and period changes, and reduce reliance on Excel aggregation. It enables store management from the headquarters perspective, and ensures operations, supervisors, and marketing all make decisions from the same data.
Q. Isn’t Excel sufficient for management?
A. It works at first, but as the number of franchise locations and delivery apps grows, Excel aggregation quickly hits its limits. Aligning store names and time frames per platform, calculating growth rates, and generating reports become time‑consuming and error‑prone. Headquarters should focus on analysis rather than data collection.
Q. Is looking at delivery sales alone enough?
A. Delivery sales are a valuable starting point, but they’re limited when viewed in isolation. Headquarters must evaluate delivery sales alongside total sales, dine‑in sales, cost of goods, promotional spend, royalties, receivables, and settlement data, because higher delivery revenue doesn’t always translate into better profitability.
DELIVERY SALES MANAGEMENT · FDAM
Your current delivery‑app revenue,
are you tracking it separately by platform?
Delivery revenue may be rising, but if headquarters still relies on platform‑by‑platform checks and Excel aggregation, operational speed will inevitably lag.
With FDAM’s unified delivery‑sales view, see each franchise location’s revenue trends, period‑over‑period changes, and platform share at a glance.
Request a deployment consultation※ This content provides general information from the perspective of franchisor headquarters operations. Delivery‑app fees, settlement methods, and platform policies can vary by timing and contract terms, so you should verify each platform’s policy alongside your internal headquarters guidelines during actual operations.