
We analyze why franchisor headquarters must manage franchise location profit structures with data, using on‑site supervisor data.
FRANCHISE INSIGHT · REVENUE MANAGEMENT
Restaurant sales are rising
Why are franchisees struggling?
The uncomfortable truth about franchise location profit structures — core management strategies revealed through delivery fee, cost, and waste rate data.

On‑site supervisors’ calculations of delivery franchise location profit structures (based on field data).
CORE SUMMARY
Even when a delivery franchise location sells a menu item priced at 18,000 won, only about 5,500 won remains. Fees, delivery costs, and product costs consume 75‑80 % of revenue. When a franchise location struggles, the franchisor headquarters feels the strain.A system that manages profit structures, not just sales.We analyze why this is essential for franchisor headquarters today, using field data.
Sold for 18,000 won, but only 5,500 won stays in hand?
The uncomfortable truth of delivery operators
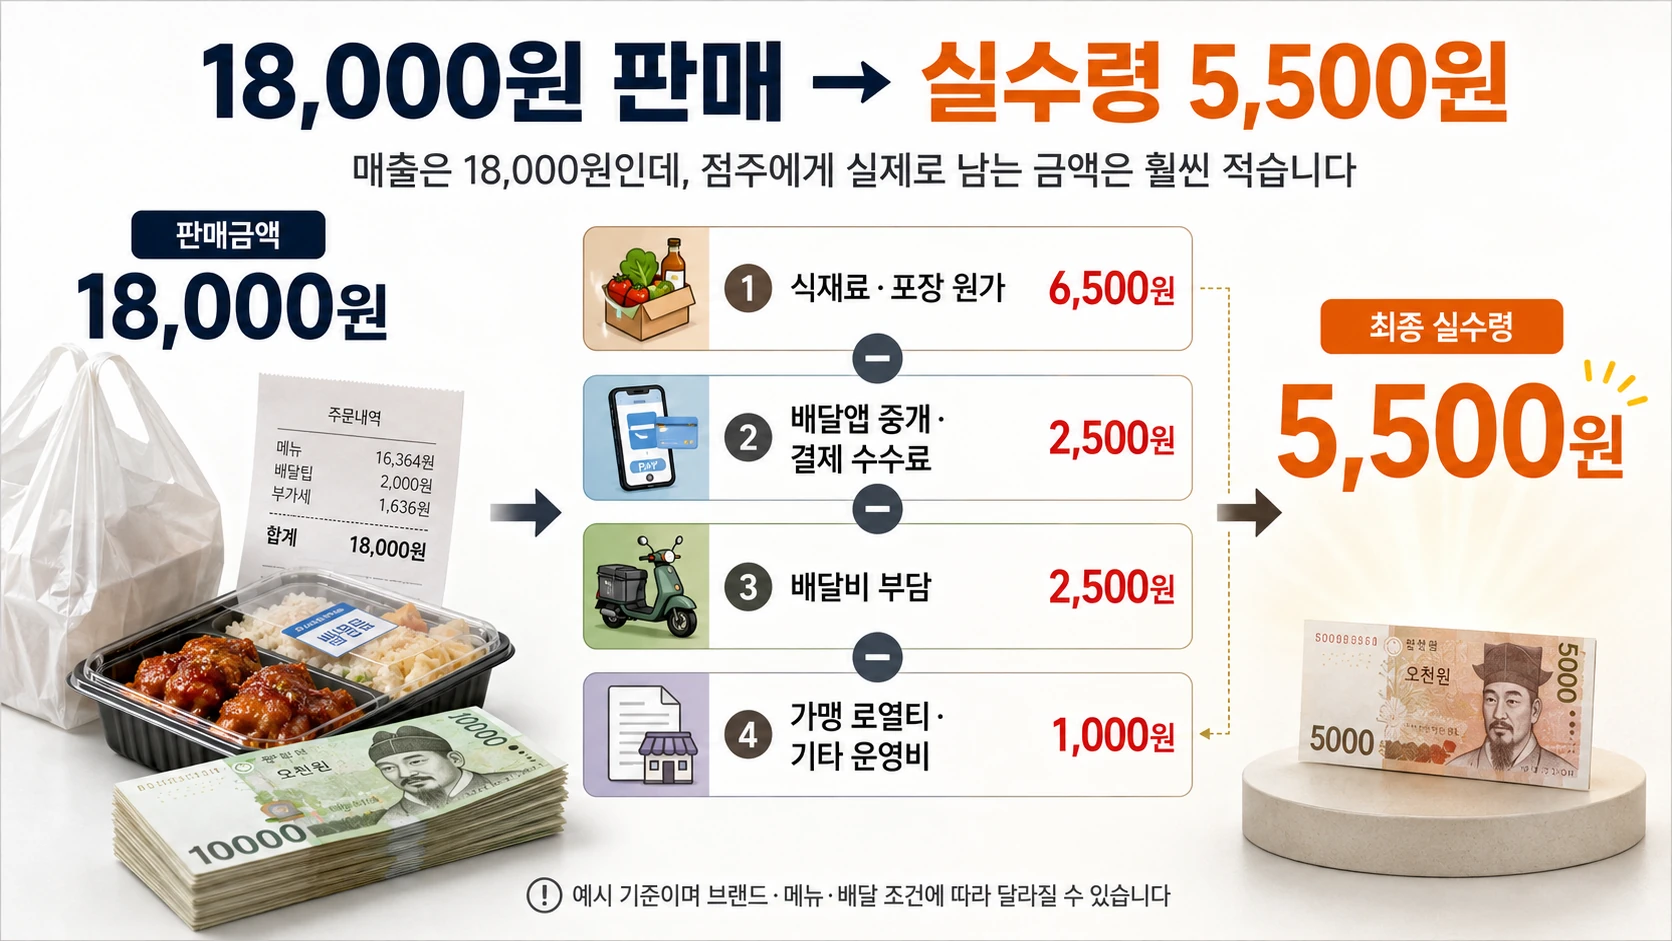
Simulation of net earnings after applying a 35 % cost basis and subtracting delivery‑app fees and delivery charges.
We asked a delivery‑focused franchisor headquarters, “What is the net profit per menu item?”
“Assuming a 35 % cost and subtracting all fees, an 18,000 won menu leaves just over 5,500 won.”
This isn’t a theoretical figure from somewhere in the industry. It’s real field data calculated by active supervisors who manage multiple brands on a per‑menu basis. When you break down the deductions for a single 18,000 won menu sold via delivery, it looks like this.
| Item | Rate / Amount |
|---|---|
| Cost of goods sold (cost ratio 35%) | ≈ 6,300 KRW |
| Delivery app brokerage fee | 7.8–7.9% → ≈ 1,400 KRW |
| Card fee + VAT | 3.3% → ≈ 600 KRW |
| Delivery fee (rider) | 2,900–3,400 KRW |
| Net amount retained | ≈ 5,300–5,800 KRW |
Here’s the bottom line: once you subtract rent, labor, utilities, and packaging costs, there’s essentially no profit left. The lower the average ticket, the harsher the math. When a minimum order of 10,000 KRW is paired with a 2,500 KRW coupon, settlement can drop to the 2,900 KRW range.
Café locations face an even more extreme scenario. Selling an 8,000 KRW beverage for delivery and applying a coupon can result in a settlement of just 2,900 KRW—a common occurrence on the ground. Adding fees, delivery costs, coupons, time‑sale discounts, and review incentives only worsens the margin.Nearly half of revenue flows to the platformThis is the resulting structure.
Key takeaways
For an average ticket of 15,000–20,000 KRW, total delivery‑related costs consume 40–45% of revenue.Add a 35% cost of goods, and 75–80% of revenue is already spent. Sales are a number; profit is reality.
Sales may be up, but why are franchise locations still struggling?
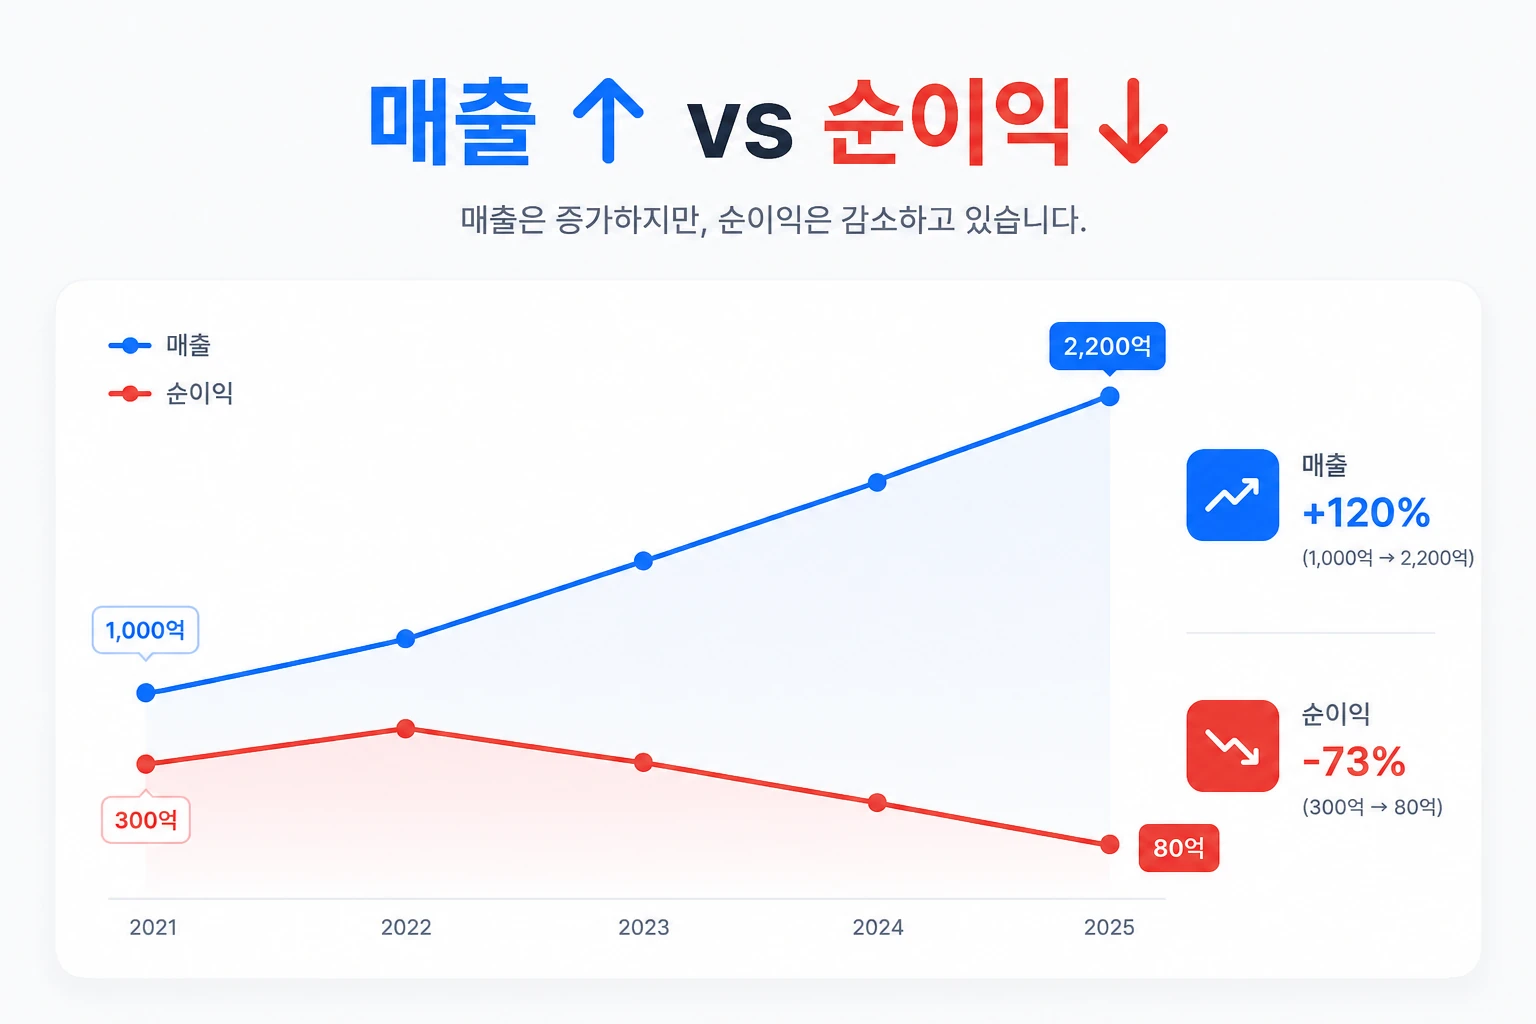
The structural reality of the restaurant sector where sales grow as net profit shrinks.
According to the Korea Food Service Industry Institute, total restaurant sales are projected to rise about 7–10% year‑over‑year in 2023–2024. Yet during the same period, restaurant closure rates also climbed. Why does this contradictory situation exist?
There is only one answer.Because the sales increase is driven by price hikes.In fact, average menu prices rose about 8.2% throughout 2023. Higher menu prices boosted sales figures, but three cost categories surged simultaneously.
- Raw material costs:Food‑ingredient prices jumped 15–20% on average over two years.
- Labor costs:Minimum wage rising from ₩9,860 in 2024 to ₩10,030 in 2025, with annual increases.
- Delivery platform fees:Commission 7.8–7.9% + card & VAT 3.3% + delivery fee ₩2,900–₩3,400 + advertising costs.
In the end, sales are just numbers; profit is the reality. Field supervisors calculate that, based on an average ticket of ₩15,000–₩20,000, total delivery‑related expenses consume 40–45% of sales. Adding coupons, time‑sale discounts, and review incentives pushes the share to roughly half of sales flowing to the platform.
When a franchise location struggles, the franchisor headquarters feels the strain — why this issue matters to headquarters.

Losing a franchise location directly reduces brand trust.
When a franchise location is under pressure, it’s not only the franchisee who suffers.The franchisor headquarters also feels the impact.As franchise location profitability declines, the challenges faced by headquarters unfold in this order.
Franchise location profitability deteriorates
Delivery fees and cost burdens sharply cut franchisee net earnings
Franchise location turnover rises
Franchisees who can’t sustain choose contract termination or closure
Brand credibility declines
Fewer stores → lower brand awareness and competitiveness
Difficulty recruiting new franchisees reduces headquarters revenue
Both franchise revenue drops and brand rebuilding costs occur simultaneously
Delivery‑focused franchise locations are especially vulnerable. Independent restaurants can adjust menu prices or switch to cheaper ingredients when costs rise, but franchise locations must use headquarters‑approved supplies and pricing policies.
In practice, when chicken wholesale prices jumped 30%, the headquarters’ supply price wasn’t adjusted until six months later. During that six‑month period, the franchise location’s margin was cut in half.One of the biggest reasons franchise locations can’t survive is that the franchisor headquarters’ response fails to keep up with on‑site speed.
Common operational challenges faced by headquarters
· Inability to assess each franchise location’s profitability in real time
· Slowed headquarters‑level response to ingredient price fluctuations
· Structural limit of a single supervisor overseeing multiple locations
· Management that aggregates sales without separating delivery and dine‑in channel profitability
Three management strategies for headquarters to revive franchise locations
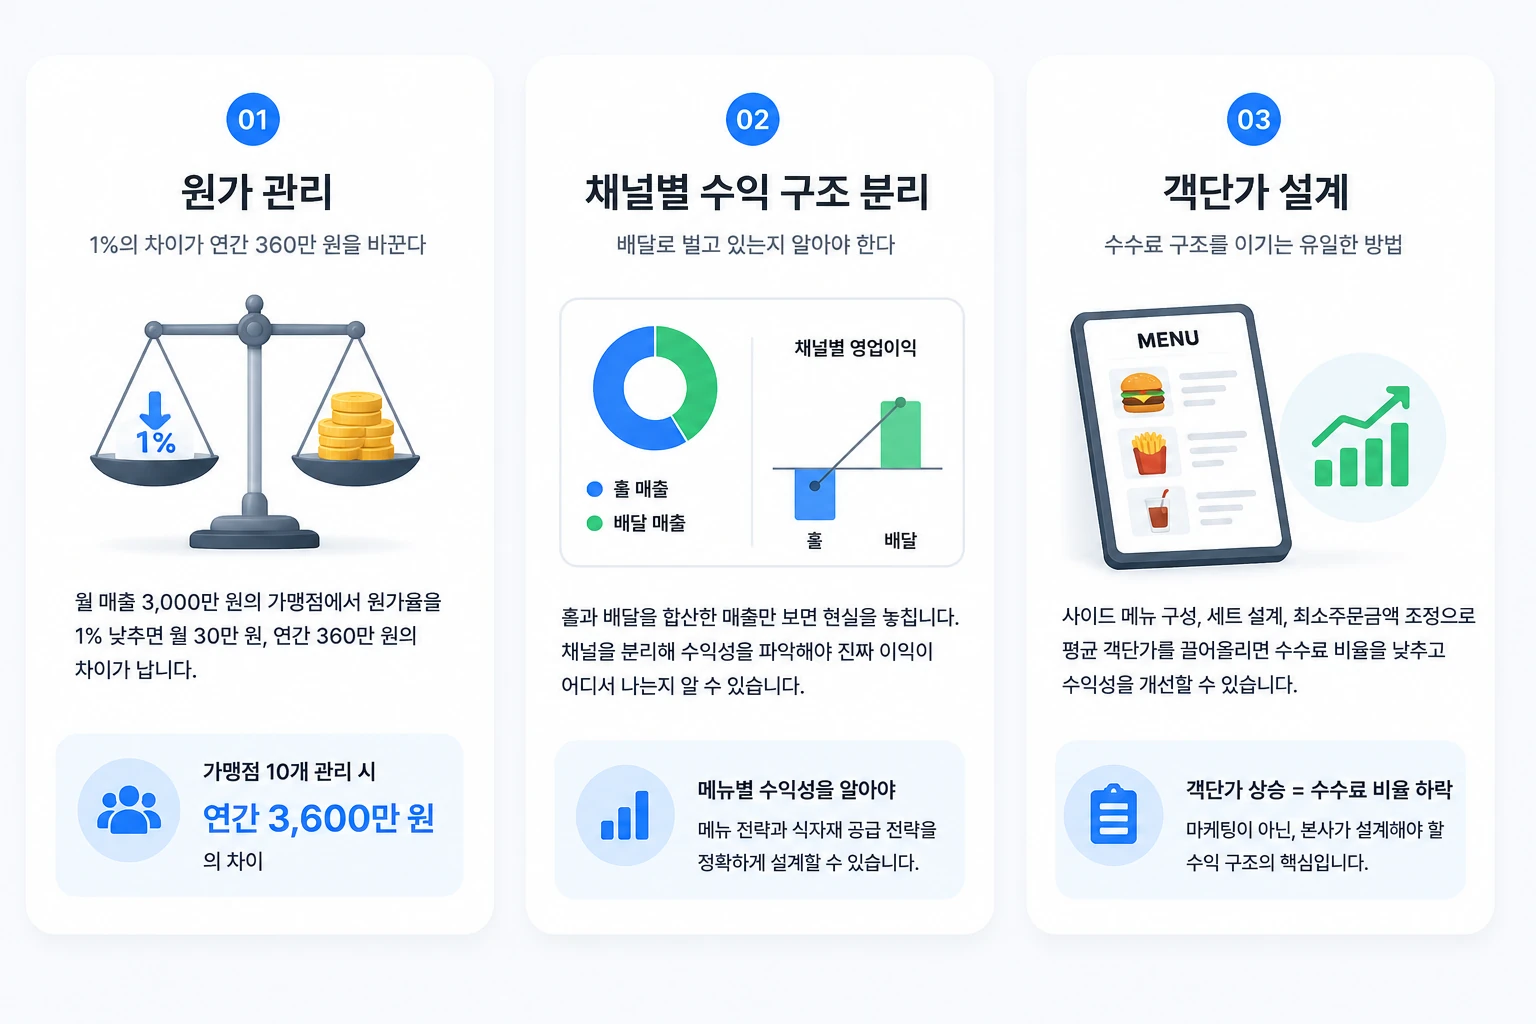
Three headquarters‑level management strategies to safeguard franchise location profit structure
Cost control — a 1% shift changes annual profit by 3.6 million KRW
For a franchise location generating 30 million KRW in monthly sales with a 35% cost ratio, costs equal 10.5 million KRW. Reducing that ratio by just 1% would30 k KRW per month, 3.6 M KRW per yearthe difference. Managing ten franchise locations would translate to a 36 million KRW annual variance.
Simply tracking real‑time ingredient cost fluctuations and maintaining optimal order quantities can generate this gap. That’s why headquarters need a baseline cost metric and a system to monitor each franchise location.
Separate profit structures by channel — determine whether revenue comes from delivery or dine‑in.
Field supervisors often say:"Looking only at combined delivery and dine‑in sales blinds us to reality. We need to separate whether dine‑in is subsidizing delivery or if delivery is the true profit channel."
High‑selling items aren’t always the most profitable. If Menu A sells 50 units daily with a 65% cost ratio, and Menu B sells 20 units with a 30% cost ratio, Menu B actually sustains the store. Headquarters must have profitability data for each menu across all franchise locations to design effective menu and supply strategies.
Average ticket design — the only way to beat the fee structure
Under delivery fee structures, lower average tickets sharply erode profitability. Raising the average ticket through side‑item offerings, set designs, and adjusting minimum order amounts is the most direct way to reduce fee percentages.
This is not merely a marketing tactic;it’s a profit‑structure issue that headquarters must design. As practitioners increasingly view delivery as a fixed‑cost‑spreading channel and dine‑in as the profit driver, a headquarters‑level menu strategy redesign is essential.
Can a single supervisor intuitively manage twenty franchise locations?

Without a data‑driven multi‑store management system, problems are always discovered after the fact.
Supervisors on the ground often say this frankly.
"We used to rely on experience, but now nothing makes sense without data—neither the franchisee nor the headquarters."
When one supervisor oversees 10–20 franchise locations, managing each store’s cost flow, inventory status, and channel‑specific profit mentally is structurally impossible. The bigger issue is that managing by gut meansyou only recognize the problem after it occurs.Food waste piles up, low‑margin menu items keep selling, and over‑ordering shows up in the numbers only after the fact.
The average food‑waste rate in the restaurant industry is about 8–12%. For a store with a monthly food cost of 5 million KRW, that means 400–600 thousand KRW ends up in the trash each month. If franchisor headquarters could track this metric in real time for each franchise location and intervene immediately when a store exceeds the benchmark, imagine the impact—saving tens of millions of won annually across ten franchise locations.
Key insight
Franchise location management isdetecting problemsnotintervening after problems arisebut intervening before problems arise. That difference hinges on whether you have a data system.
FDAM — How franchisor headquarters can “keep franchise locations thriving”

FDAM — an integrated management solution for franchisor headquarters and their franchise locations.
FDAM is not just a logistics ordering system.It’s an integrated management solution that lets franchisor headquarters understand franchise location profit structures in real time and intervene proactively..
| Headquarters' Concerns | FDAM / Logistics FDAM solution |
|---|---|
| Unable to determine profitability by franchise location | Provides real-time cost‑ratio and channel revenue data for each franchise location |
| Hard to curb food‑material waste and over‑ordering | Automatically calculates optimal order quantities using data |
| Supervisors can’t manage multiple franchise locations | Detects anomalies instantly via an integrated KPI dashboard |
| Menu‑level profitability is unknown | Delivers menu‑by‑menu net profit analysis reports |
| Controlling labor‑cost efficiency is challenging | Analyzes labor‑cost efficiency relative to sales by time slot |
Core Value
The franchisor headquarters can detect issues with data and intervene before the franchise location even notices a problem.This isn’t just operational efficiency—it becomes the headquarters’ competitive edge that boosts franchise location survival rates. The longer franchise locations thrive, the stronger the brand becomes.
The quality of franchise location management directly determines the brand’s lifespan
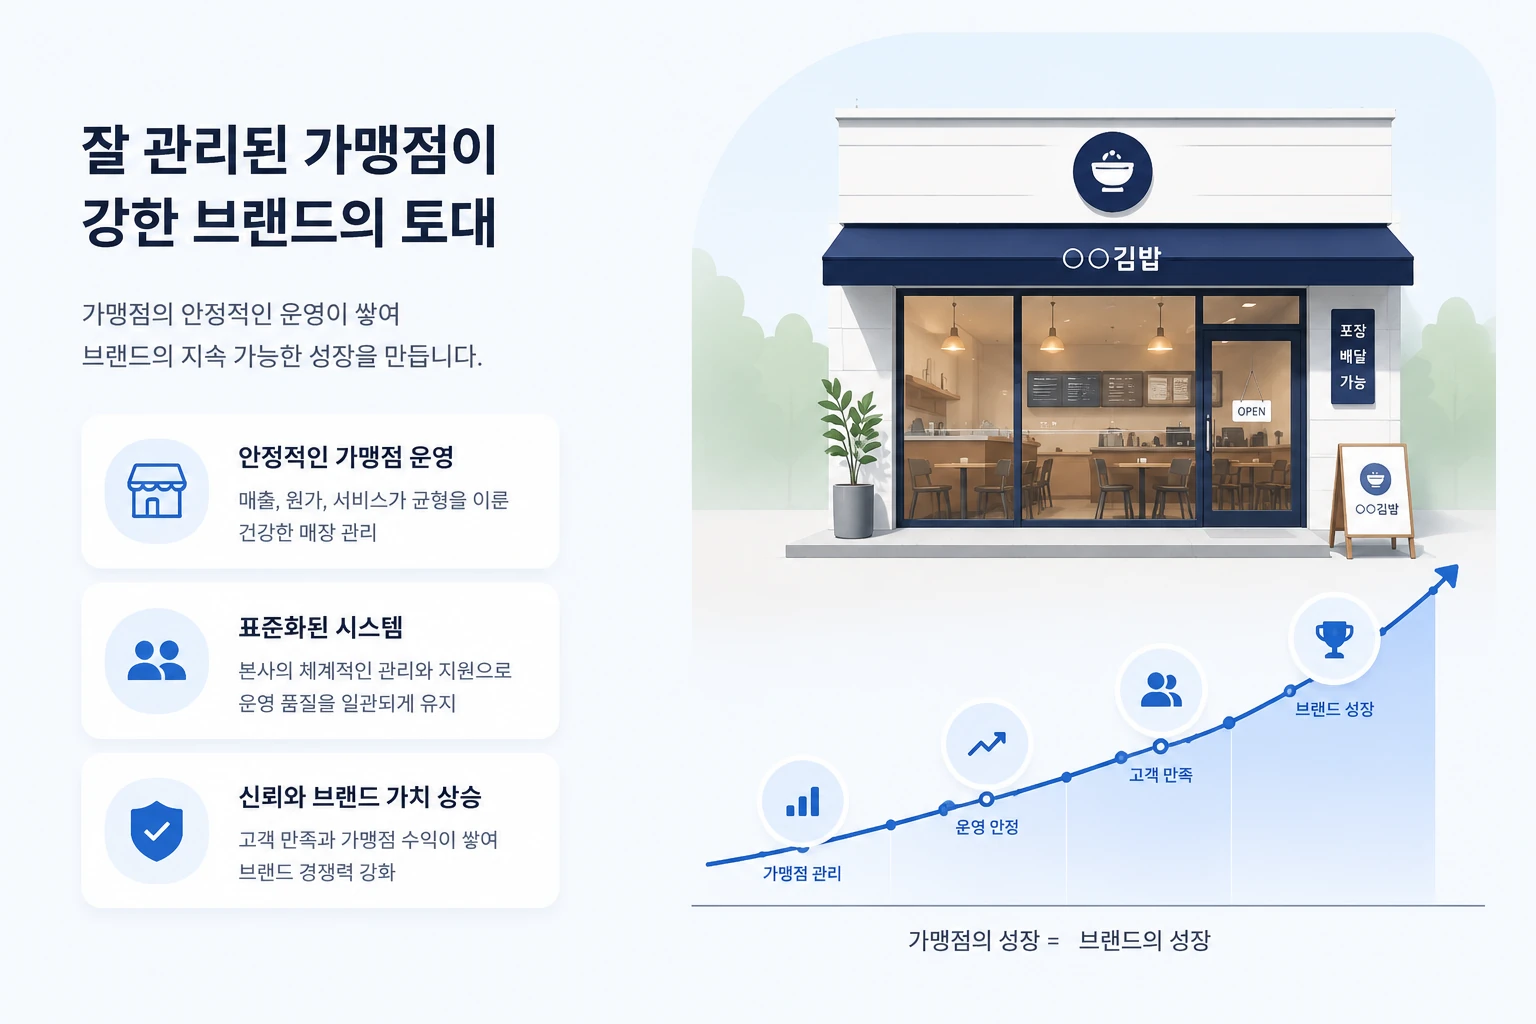
Well‑managed franchise locations are the foundation of a strong brand
Even when sales rise, why franchisees struggle is now explained clearly with numbers.
- Revenue derived solely from delivery fees and delivery charges40~45%expenditure
- If you add a 35% cost of goods, already75~80%depletion
- including coupons, advertising, labor, and rent, a zero‑margin structure
Expecting franchisees to survive on their own within this structure is unrealistic. The franchisor headquarters must use data to manage franchise location profitability and intervene before issues arise, so the entire brand can stay viable.
Managing well beats selling well. That is the core capability franchisor headquarters needs today.
Frequently Asked Questions
Q. What is the actual profit structure for delivery franchise locations?
A. Based on a 35% cost of goods, selling an 18,000‑won menu item for delivery leaves about 5,300‑5,800 won after deducting platform fees (7.8‑7.9%), card and VAT (3.3%), and rider delivery cost (2,900‑3,400 won). After rent, labor, and packaging costs are subtracted, the net profit is virtually zero. The lower the average ticket, the harsher the structure.
Q. How does declining franchise location profitability affect the franchisor headquarters?
A. Declining franchise profitability triggers a cascade: franchisee attrition → reduced brand credibility → difficulty recruiting new franchisees → lower headquarters revenue. Managing franchise locations is a survival strategy for the franchisor, not just a benefit for franchisees.
Q. How can a supervisor efficiently manage multiple franchise locations?
A. When one supervisor oversees 10‑20 franchise locations, intuition‑based management hits its limits. Real‑time dashboards must consolidate each location’s cost ratio, inventory status, and channel revenue, and a data‑driven system must enable immediate intervention when anomalies appear.
Q. What is the food‑waste rate at franchise locations, and how can it be reduced?
A. The restaurant industry averages an 8‑12% food‑waste rate. For a monthly food budget of 5 million won, that means 400‑600 k won wasted each month. Implementing a data‑driven ordering system can cut waste to 3‑5%, saving tens of millions of won annually across ten franchise locations.
Q. Why must the franchisor headquarters manage profitability by menu item?
A. A best‑selling menu isn’t always the most profitable. If a menu selling 50 units daily has a 65% cost ratio, its profit contribution is lower than a menu selling 20 units with a 30% cost ratio. The headquarters needs to track real profit margins for every menu across all franchise locations to inform sourcing strategies and menu redesigns with data.
Q. How does FDAM/Logistics FDAM differ from a traditional POS system?
A. Traditional POS systems focus on sales aggregation. FDAM/Logistics FDAM builds on POS data to deliver cost‑ratio analysis, channel‑level profit separation, inventory and order optimization, and comparative profit‑structure reporting for each franchise location—all in a single, franchise‑focused solution. Headquarters supervisors can monitor each store’s key metrics in real time without visiting the site.
FRANCHISE MANAGEMENT · FDAM
Your franchise locations today,
how well are they being managed?
The era of supervisors wandering around on intuition is over.
Cost ratios, channel profits, and inventory waste rates for each franchise location
must be visible as data right now.
A franchise location’s longevity strengthens the brand.
Request a Deployment Consultation